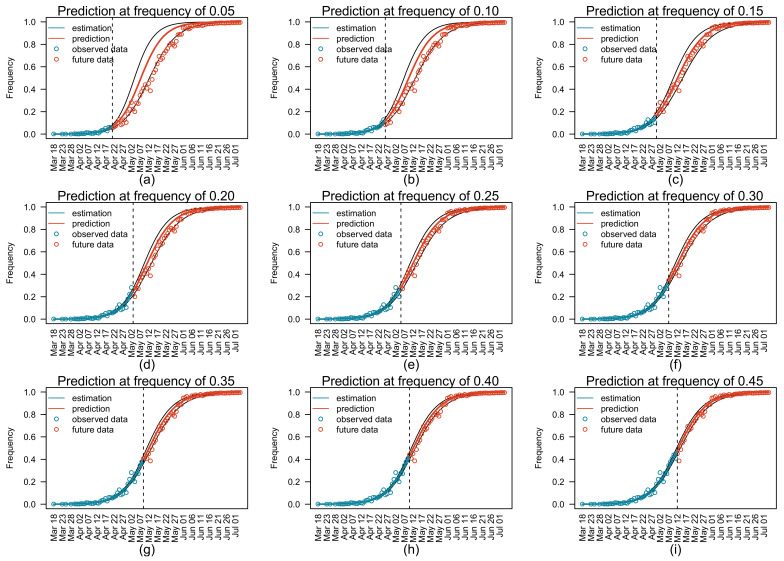
Figure 2.
Prediction of future relative frequencies of the Delta variant using partial observations. Panels (a–i) represent predictions estimated using observations until 21 April, 26 April, 30 April, 3 May, 5 May, 7 May, 9 May, 10 May, and 12 May 2021, respectively. Blue circles represent observed relative frequencies used for predictions. Red circles represent future observations that were not used for predictions. The vertical dashed line in each panel represents the date of the last observations used for prediction. The blue curve in each panel represents the maximum likelihood estimates of relative frequencies of Delta, and the red curve represents the relative frequencies predicted by the model using the estimated parameters. Black curves represent 95% confidence intervals of the relative frequencies of Delta.

