
Figure 2.
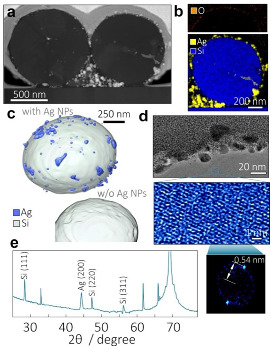
(a) STEM image of the cross-sectional central cut made through the 1.1-µm diameter Ag-Si microspheres; (b) EDX composition mapping of the right-most Ag-Si microsphere showing distribution of Ag and Si elements as well as an oxide shell (top panel); (c) 3D model of the isolated Ag-Si microsphere made through SEM tomographic reconstruction from the series of multiple images of cross-sectional cuts. Bottom panel shows the same model where Ag nanoclusters were removed to illustrate crater-like Si surface morphology; (d) TEM image of the Ag-Si microsphere surface (top panel) as well as HR-TEM image and its FFT showing crystalline structure of the Si core (bottom panel); (e) XRD pattern of the Ag-Si nanopowder. All unmarked peaks represent contribution from the underlying Si substrate.