Figure 3.

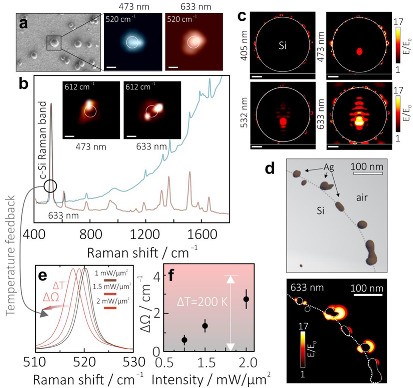
(a) Reference SEM image of the Ag-Si microspheres drop-casted onto the Si wafer as well as Raman images (at 520 ± 2 cm−1) of the chosen isolated nanoparticle at 473 and 633 nm laser pump wavelengths. (b) Representative averaged SERS spectra of the R6G capping the same Ag-Si microsphere at 473 and 633 nm laser pump wavelengths. Top insets show the distribution of the SERS signal (at 612 ± 2 cm−1) near the microsphere. (c) Normalized electric-field amplitude E/E0 near the isolated Ag-Si microsphere on the Ag mirror upon its excitation with a linearly polarized plane wave at 405, 473, 532, and 633 nm. (d) Close-up distribution of E/E0 near the isolated Ag nanoclusters on the Si surface at 633 nm pump as well as corresponding fragment of the 3D tomographic model of the Ag-Si microsphere used for modeling. (e) Shift of the detected c-Si Raman band at 520 cm−1 upon increasing the laser pump intensity (633 nm) of the Ag-Si microsphere from 0.5 to 2 mW/µm2. (f) Thermally induced shift of the c-Si band ΔΩ as a function of laser pump intensity.
