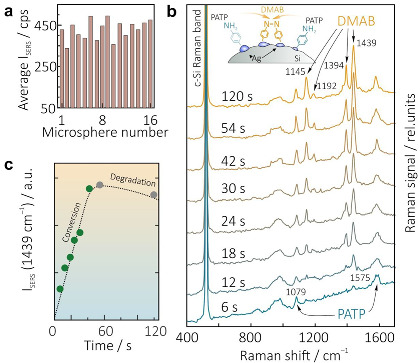
Figure 4.

(a) R6G SERS yield (intensity of the bands at 612 and 1652 cm−1) statistically averaged over measurements from 16 randomly chosen isolated Ag-Si microspheres produced at AgNO3 concentrations of 5 × 10⁻⁴ M. (b) Series of time-resolved SERS spectra of the PATP capping the isolated Ag-Si microsphere. Total laser exposure time ranging from 6 to 120 s is indicated near each spectrum. (c) Evolution of the intensity of the characteristics DMAB-related Raman band at 1439 cm−1 as a function of laser exposure time indicating PATP-to-DMAB conversion dynamics.
