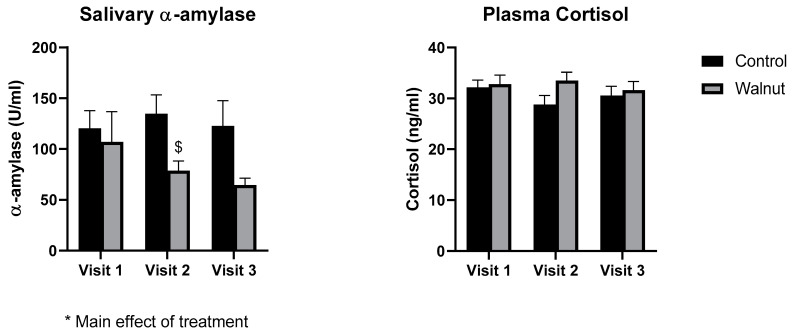
Figure 7.
The effects of walnut consumption on salivary α-amylase and plasma cortisol before, during and after the university examination period. Clinical Visit 1 occurred during the first half of the university semester, Visit 2 occurred during the university examination period, and Visit 3 occurred at the end of the university semester. * (Below graph) Denotes significant main effects, * = p < 0.05. $ Denotes a difference in means between the control and treatment (walnut) group at visit 2, $ = p < 0.05. Mixed effects analyses followed by Bonferroni multiple comparisons. Salivary α-amylase—Visit 1: control n = 26; walnut n = 28; Visit 2: control n = 26; walnut n = 27; Visit 3: control n = 25; walnut n = 27. Plasma cortisol: Visit 1: control n = 24; walnut n = 24. Visit 2: control n = 25; walnut n = 24; Visit 3: control n = 20; walnut n = 19. Small differences in sample size are due to technical issues with sample collection and withdrawals from subsequent visits. Salivary α-amylase analyses performed on samples from all 3 cohorts. Plasma cortisol analyses performed on samples from cohort 1 and 2.

