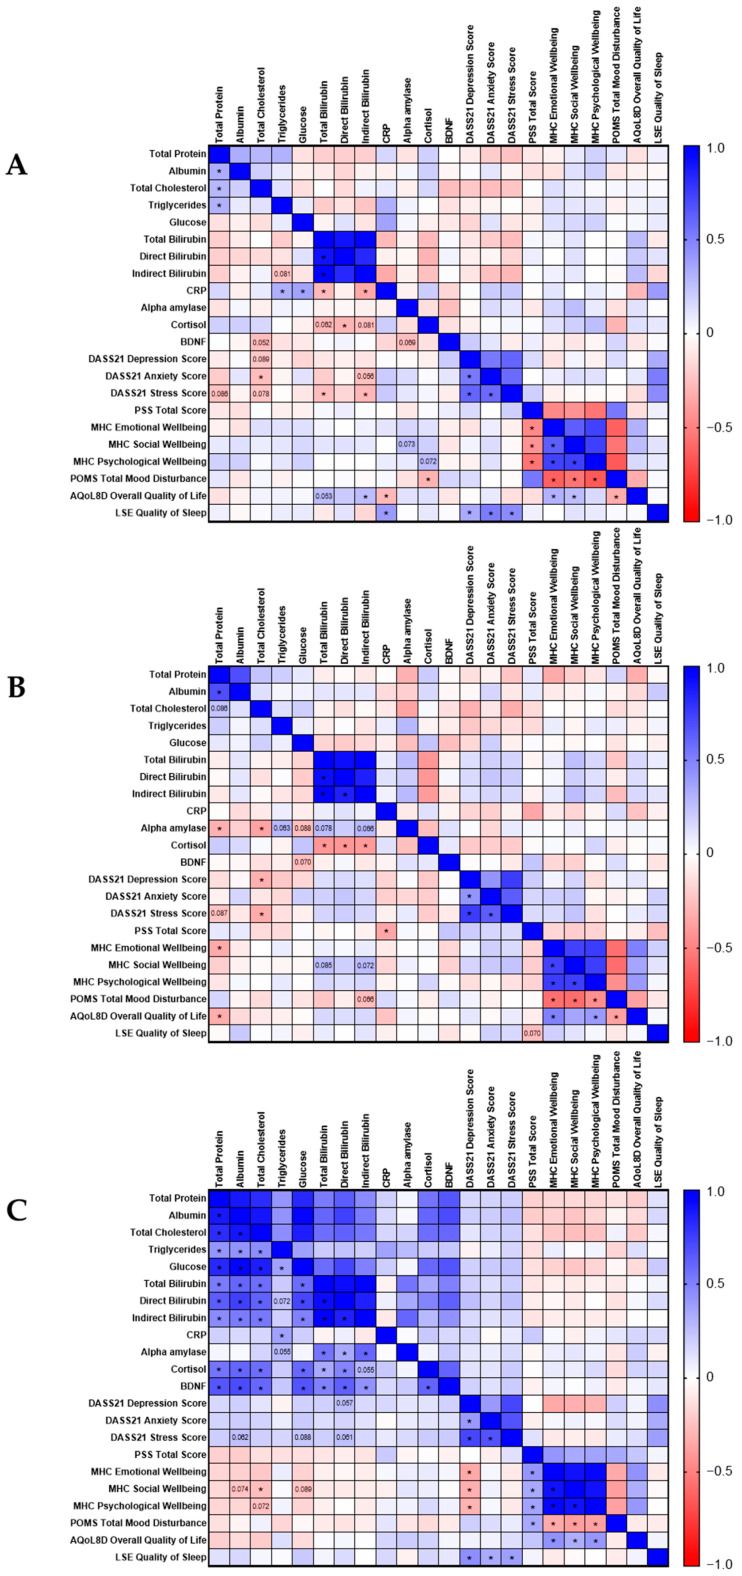
Figure 9.
Correlation matrices showing the relationships between biochemical markers and questionnaire scores at clinical visit 1 (A), clinical visit 2 (B) and clinical visit 3 (C) in all participants. Clinical Visit 1 occurred during the first half of the university semester, Visit 2 occurred during the university examination period, and Visit 3 occurred at the end of the university semester. * Denotes a p-value < 0.05. Pearson R values represented on a colour gradient ranging from −1 (red) to 1 (blue). Controls: n = 30; Walnut: n = 30. CRP, C-reactive protein; mBDNF, brain-derived neurotrophic factor; DASS21, 21-item depression, anxiety and stress scale; PSS, perceived stress scale; MHC, mental health continuum; POMS, profile of mood states; AQoL8D, 8-dimension assessing quality of life questionnaire; LSE, Leed’s sleep evaluation.

