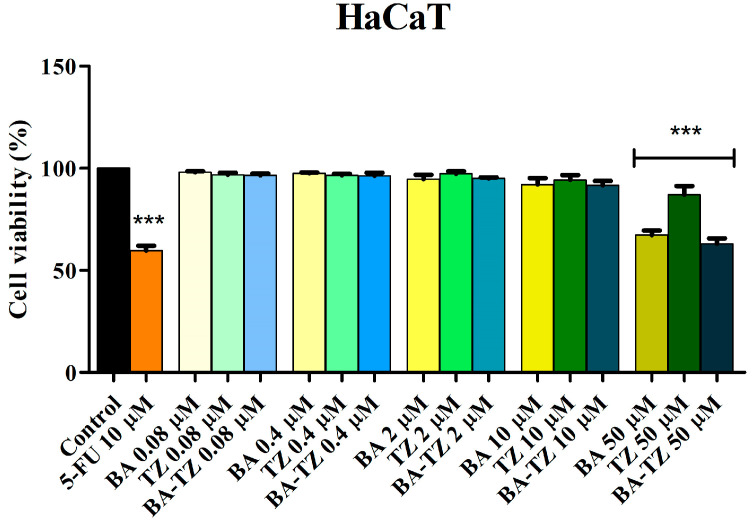
Figure 2.
Cell viability of HaCaT cells after 24 h treatment with BA-TZ 0.08, 0.4, 2, 10 and 50 μM, determined using the MTT assay. Untreated cells were used as the negative control, whereas 5-FU was used as the positive control. The results are expressed as cell viability percentage (%) normalized to the negative control (100%). The data represent the mean values ± SD of three independent experiments performed in triplicate. The statistical differences vs. the negative control was determined using two-way ANOVA analysis followed by Bonferroni’s multiple comparisons post-test (*** p < 0.0001).

