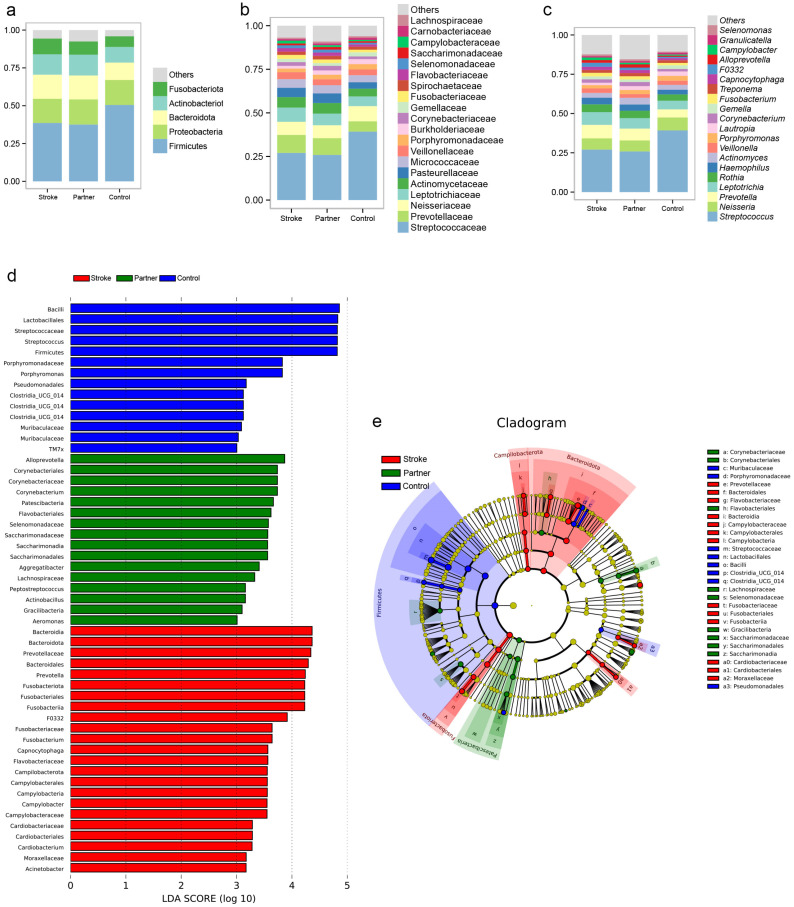
Figure 3.
The oral microbiota composition and the significantly different taxa identified by LEfSe analysis among groups. (a–c) Stacked bar plot representing the relative abundances of microbiota at phylum, family, and genus levels, respectively. (d) A histogram of the linear discriminant analysis (LDA) plot performed by LefSe analysis shows distinct oral microbiome composition between the three groups. Red indicates enriched taxa in poststroke patients, green indicates the taxa enriched in partners of poststroke patients and blue indicates taxa enriched in the control group. (e) A cladogram for taxonomic representation performed by LefSe analysis showing distinct bacterial taxa between the three groups. As an algorithm for high-dimensional biomarker discovery, LEfSe identifies genomic features that characterize differences between two or more biological conditions. By emphasizing statistical significance, biological consistency, and effect relevance, LEfSe determines the abundant feature with the greatest difference between conditions in accordance with biologically meaningful categories. For each differential feature detected using LEfSe, a linear discriminant analysis value was calculated, representing the difference in the feature between groups. Only taxas with LDA scores above ±3.0 are shown.

