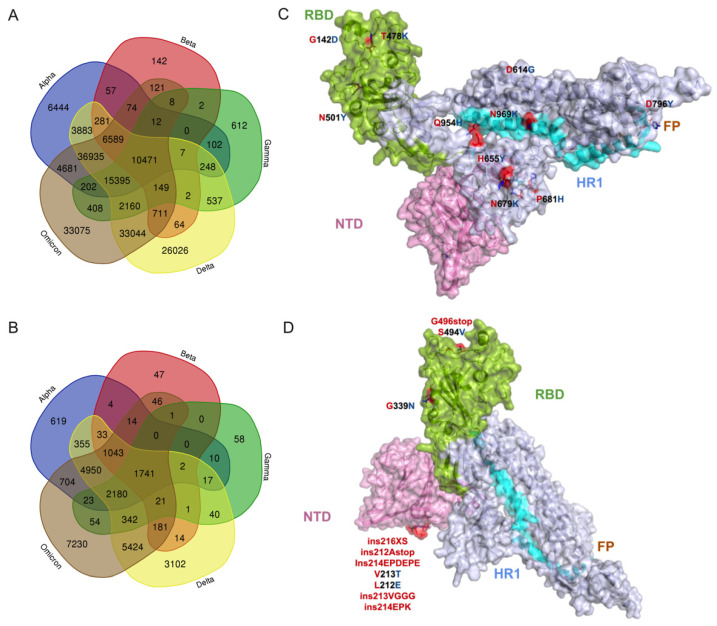
Figure 2.
The common and exclusive mutations as well as structural changes in the proteome of Omicron variants. (A) Comparison of mutational profile data between 5 VOCs. In total, 12,002,213 sequences retrieved from GISAID’s EpiCoV database were used for this analysis. (B) Comparison of spike mutational profile data between 5 VOCs. (C) Illustration of the top 10 high-prevalence common spike glycoprotein mutations (D614G, frequency 99.50%; T478K, 83.28%; G142D, 73.15%; P681H, 60.31%; N501Y, 56.86%; H655Y, 51.69%; N679K, 50.54%; D796Y, 49.77%; N969K, 49.65%; Q954H, 49.54%) shared by 5 VOCs. (D) Illustration of the top 10 high-prevalence mutation and structural changes (G339N, 0.145%; ins216XS, 0.060%; ins212Astop; 0.373%; ins214EPDEPE, 0.021%; V213T, 0.020%; L212E, 0.020%; ins213VGGG, 0.016%; ins214EPK, 0.014%; G496stop, 0.010%; S494V, 0.010%) that are exclusive to Omicron variants on the monomer’s tertiary structure. Amino acid substitutions and structural changes in Omicron variants relative to the reference strain are represented in red stick models. Four domains in spike are highlighted as follows: (i) green for receptor binding domain (RBD), (ii) purple for N-terminal domain (NTD), (iii) brown for fusion peptide (FP) domain, and (iv) cyan for the heptad repeats-1 (HR1) domain. Grey is for inter-domain regions.

