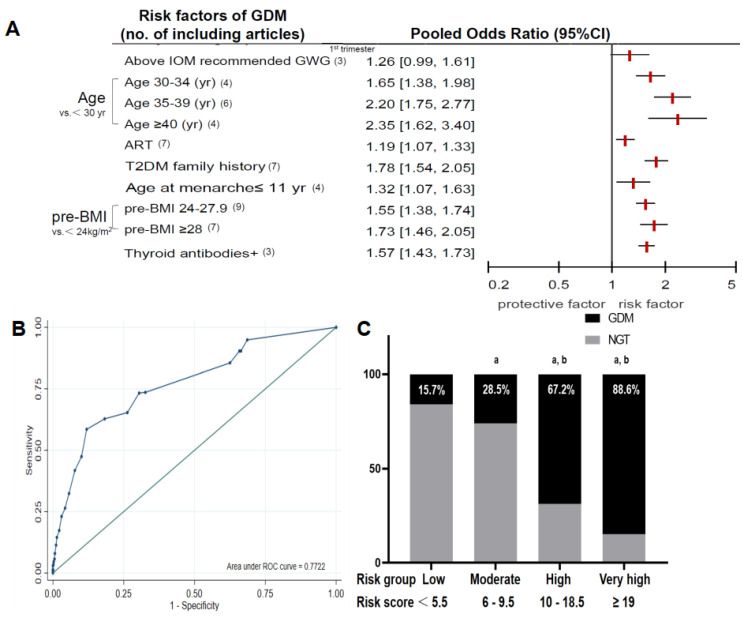
Figure 2.
The score-scaled GDM prediction model. (A) Pooled ORs and their corresponding 95% CIs for risk factors in the score-scaled GDM risk prediction model. Estimates were derived from the fully adjusted models in each included analysis. Red squares and horizontal bars represent the overall estimates and 95% CIs, respectively. (B) ROC curve for the validation cohort based on the score-scaled risk prediction model. (C) Prevalence of GDM in the four groups of the validation cohort. Pairwise comparisons were adjusted using the Bonferroni correction method. a different relative to the low-risk group by the Chi-squared test. b different as compared to the moderate risk group by the Chi-squared test.

