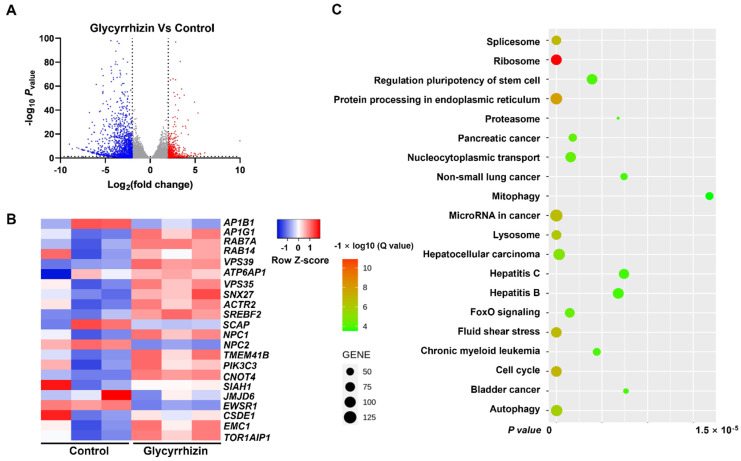
Figure 3.
Glycyrrhizin regulates gene expression in Vero E6 cells. The Vero E6 cells were cultured in a six-well plate, and after the cells adhered and grew to 80–90% confluence, the supernatant was discarded and fresh medium with or without glycyrrhizin was added for 48 h of treatment. Then, the total mRNA of the cells was extracted for gene sequencing analysis. (A) Volcano plot displaying differentially expressed genes between glycyrrhizin and control groups (n = 3 biologically independent cell samples). Significant genes were called via Cuffdiff. The red dots represent the up-regulated expressed transcripts between glycyrrhizin and control; the blue dots represent the transcripts whose expression was down-regulated. (B) Heat map of differential expression of genes associated with SARS-CoV-2 infection in control and glycyrrhizin groups (n = 3 biologically independent cell samples; FDR < 0.001). Statistical tests were embedded in Cuffdiff. Each row represents a gene, red means increased gene expression, blue means decreased gene expression and the darker the color, the more obvious the trend is. (C) KEGG pathway enrichment analysis of key targets.

