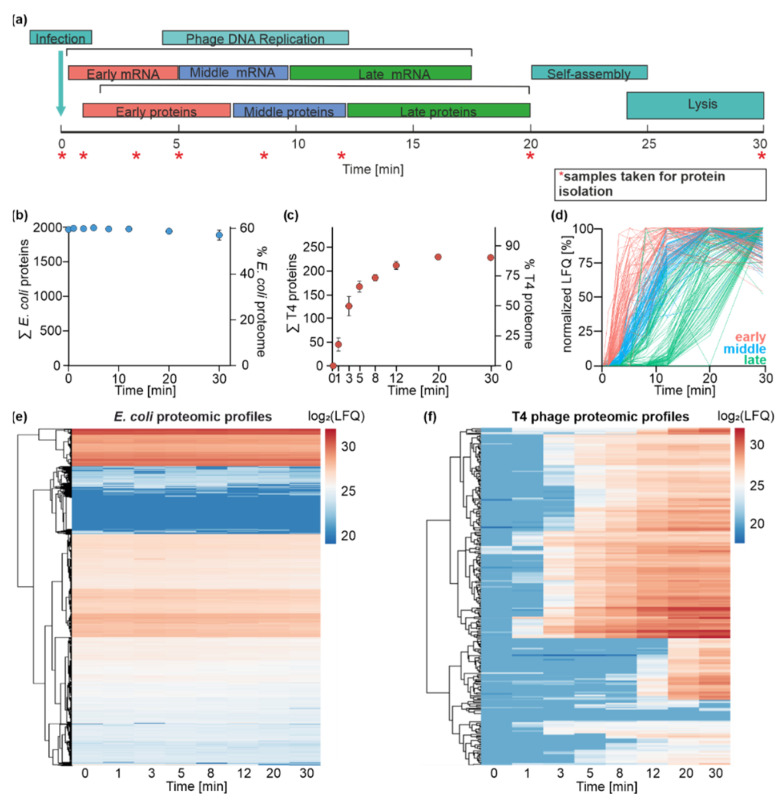
Figure 3.
Time-resolved dual-proteome of T4 phage infection of E. coli. (a) Schematic illustration of infection-phase-specific gene expression during T4 phage infection. The time points at which samples were collected for the dual-proteome are indicated with an asterisk. (b) Monitoring of E. coli proteins over the time course of infection. The left y-axis identifies the absolute number of detected proteins, and the right y-axis depicts the coverage of the annotated E. coli proteome (n = 3). E. coli proteome is not significantly altered throughout the infection process. (c) Monitoring of T4 phage proteins over the time course of infection. The left y-axis identifies the absolute number of detected proteins, and the right y-axis depicts the coverage of the annotated T4 phage proteome (n = 3). The diversity of the T4 phage proteome increases throughout the infection. After 20 min, 85% of annotated T4 phage proteins are identified. (d) Assignment of T4 phage proteins to specific temporal groups. Criteria for the classification of T4 phage proteins are shown in the graph: early (red), middle (blue), and late (green) based on the time frame of the onset of protein detection and its maximal abundance values. Plots of all T4 phage proteins over the time course of infection based on mean MaxQuant LFQ values normalized to the highest mean LFQ value of each protein. Proteins are colored by classification based on their temporal appearance (n = 3). (e) Heatmap representation of the clustered E. coli protein abundance over the time course of infection based on log2-transformed LFQ values (n = 3). (f) Heatmap representation of T4 phage protein log2-LFQ intensity over the time course of infection (n = 3).

