Figure 4.
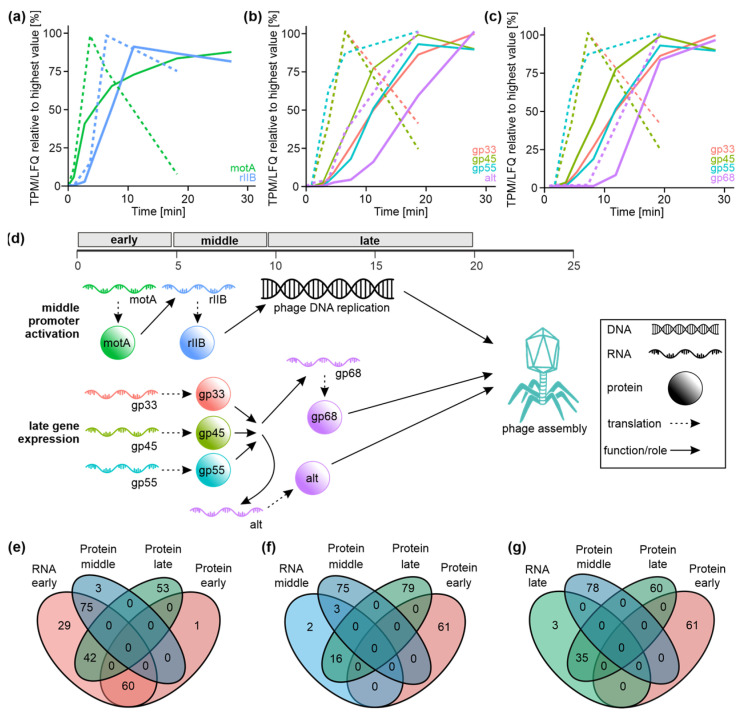
Analysis of correlation of transcriptome and proteome data of T4 phage infection. (a–c) Examples of the gene expression regulation during T4 phage infection based on the transcriptome (dashed line) and proteome data (continuous line). (a) Example of MotA expression which activates middle transcription of the rIIB gene. (b,c) Expression of the activators of late transcription—gp33, gp45 and gp55 triggers late expression of Alt (b) and gp68 (c). (d) Schematic representation of selected gene regulatory cascades during T4 phage infection. A similar color code as shown in (a–c) was applied. Infection-phase-specific transcripts and proteins are shown in the order of their appearance during infection based on the data shown in (a–c). Arrows indicate the transition between gene regulatory and molecular events. (e–g) Venn diagrams displaying overlaps of T4 phage gene classes based on proteome data with either early genes (e), middle genes (f) or late genes (g) derived from transcriptome data set.

