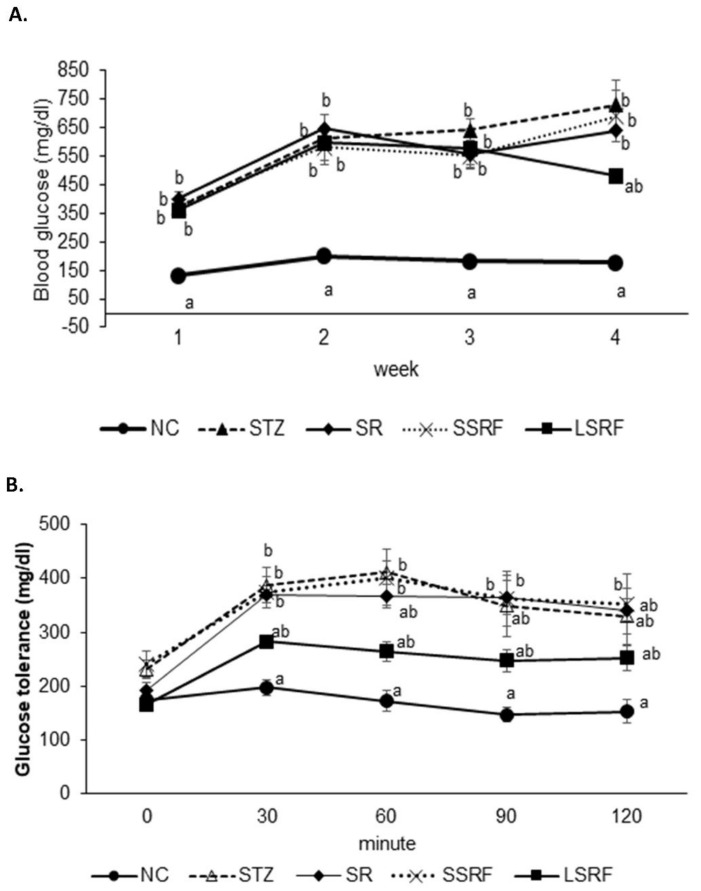
Figure 1.
The blood glucose monitored weekly in the 4-weeks experiment (A). Glucose tolerance test performed at week 3 (B). The NC is negative control group. Additionally, the STZ-induced hyperglycemic mice are gavage fed dH2O (STZ group), soybean residue (SR group), short time soybean residue fermentation (SSRF group) and longtime soybean residue fermentation (LSRF group). The mean values indicated with letter difference is statistically different at p-value less than 0.05.

