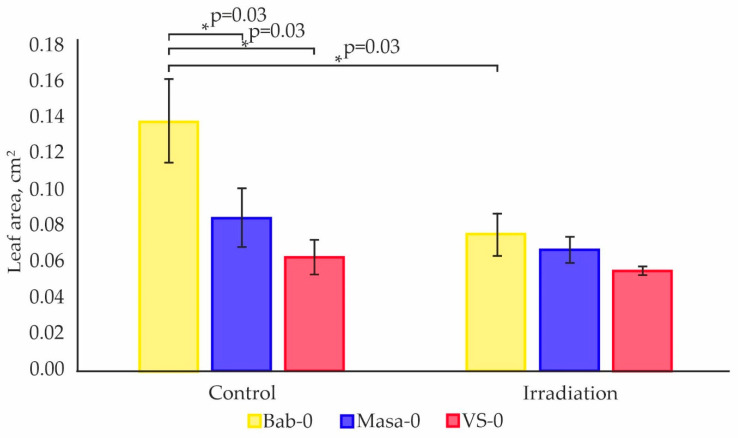
Figure 3.
Mean leaf area of one plant (cm2) measured on the 11th day of cultivation for four biological replicates (up to 20 plants per replicate). “Control” represents plants from untreated seeds of accessions Bab-0 (Background), Masa-0 (Chronic LD), VS-0 (Chronic LD). “Irradiation“ represents plants grown from seeds exposed to acute γ-irradiation at a dose of 150 Gy (Acute HD). Significant difference with exact p-values (Mann–Whitney U-test) are denoted by asterisk. The graphs were created using RStudio v1.4 (R-Tools Technology, Richmond Hill, ON, Canada).

