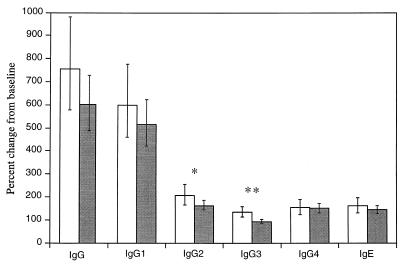
FIG. 1.
Changes in antitetanus IgG and specific isotypes at 3 months after tetanus vaccination. Levels are expressed as the percent change compared to prevaccination levels (e.g., 100% represents no change). Clear bars represent findings in the noninfected group, and shaded bars represent findings in the O. volvulus-infected group. The geometric mean changes and 95% CI values are shown. Statistical comparisons were made between the two study groups: ∗, P < 0.05; ∗∗, P < 0.001.

