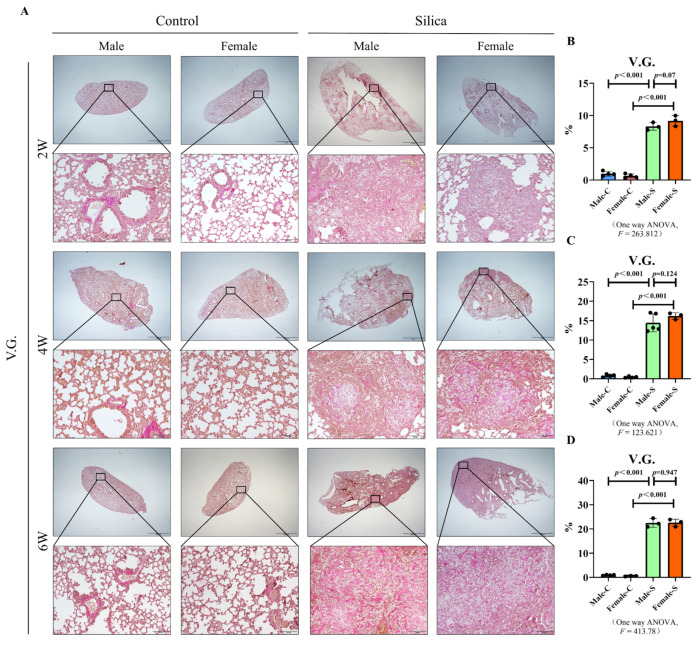
Figure 3.
V.G. staining of the male and female mice exposed to silica in two, four, and six weeks, and the control groups. (A) V.G. staining of the lung tissues in mice exposed to silica (scale bar = 2000 and 100 µm). (B–D) Statistical analysis of the V.G. staining, n = 5 per group ((B)—2W, (C)—4W, (D)—6W).

