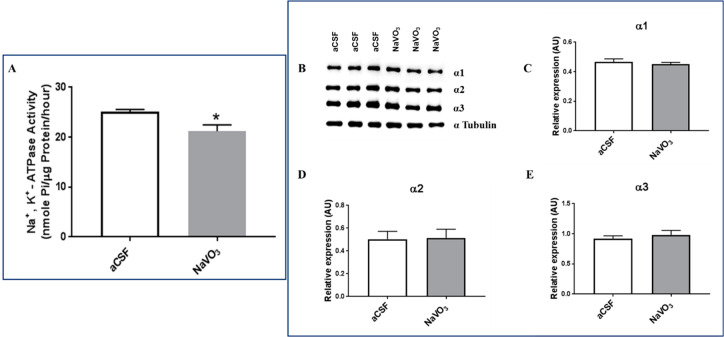
Figure 5.
Effect of NaVO3 administration on brain Na+, K+-ATPase activity and Na+, K+ ATPase α isoform expression. Mice were treated with NaVO3 (3 µL from a 10 mM stock solution in aCSF) and their behavior was examined as described in the legend to Figure 3 and Figure 4. Following the behavioral tests (Figure 4) the mice were euthanized. The brains were exposed and the frontal cortex was dissected. A microsomal fraction was prepared and Na+, K+-ATPase activity was determined as described in Materials and Methods. Na+, K+-ATPase activity (A) is expressed as the mean ± SEM (n = 6). Na+, K+-ATPase activity in the control mice (25.72 nmol Pi/μg protein/h) represented 35% of the total ATPase activity (71.94 nmol Pi/μg protein/h) in this membrane preparation. Na+, K+-ATPase α subunit isoform expression was determined by western blot analysis as described in Materials and Methods. (A): Representative western blots. (B): Quantitative α isoform expression (C–E) values were normalized to the levels of α Tubulin (n = 4). * significantly lower than in mice receiving aCSF, p 0.005.

