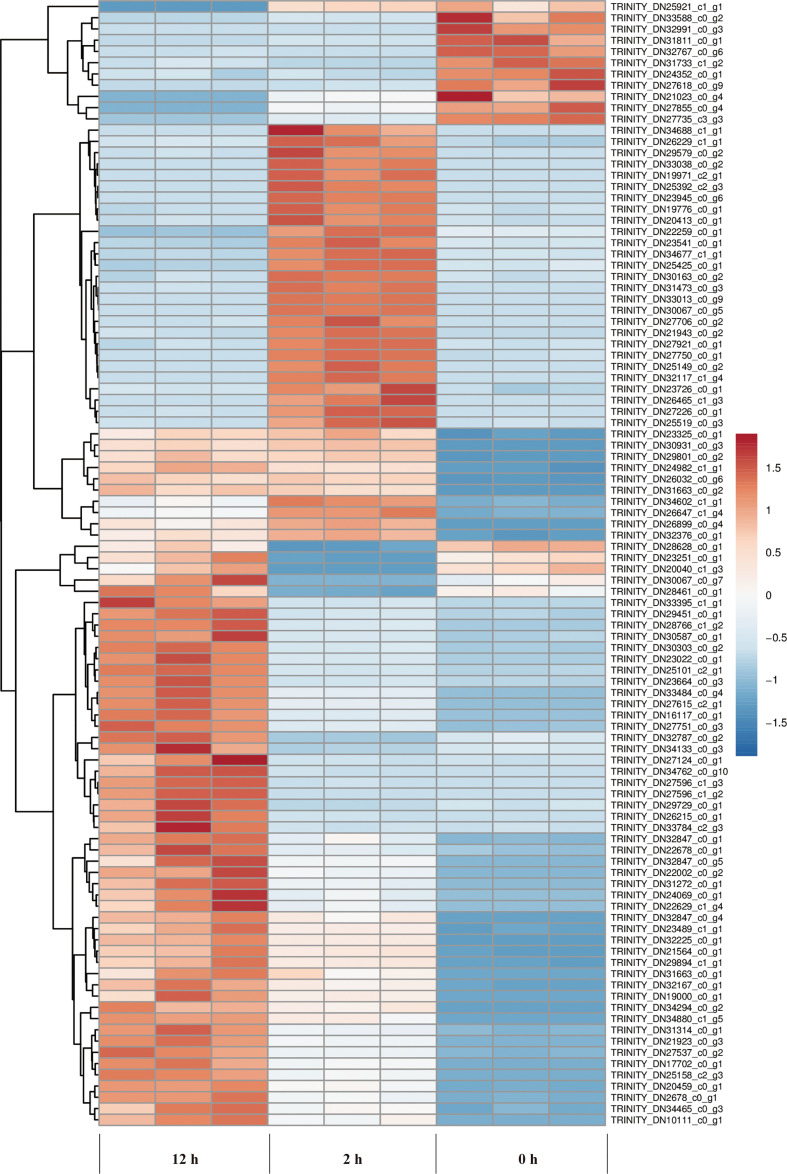
Figure 7.
Cluster analysis of DEGs at different periods (0, 2, and 12 h) of salt stress. The abscissa represents the three independent biological replicates for the control (0 h), 2 h and 12 h duration of salt stress treatment, respectively. The ordinate represents the ID of a hundred genes with smallest p value. Color gradient from blue to red represents gene expression level from low to high.

