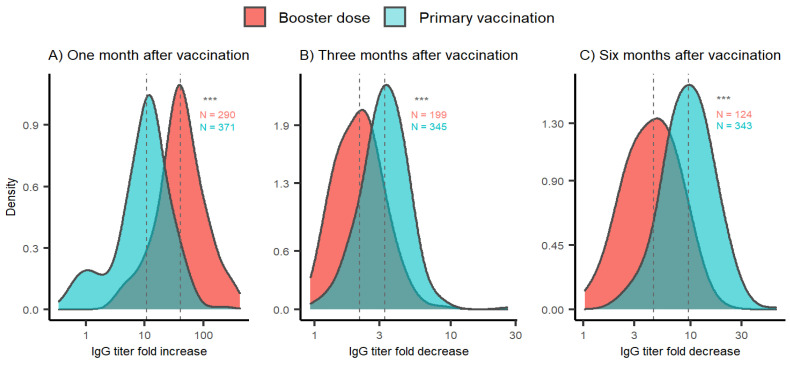
Figure 2.
Anti-SARS-CoV-2 titer fold change distribution after primovaccination (blue) and booster vaccination (red). (A) Titer fold changes one month after vaccination calculated relative to IgG titers before the respective vaccination. (B,C) Titer fold changes three and six months after vaccination calculated relative to IgG titer one month after the respective vaccination. Sera of participants acquired after COVID-19 onset were not included. The x-axis is logarithmically scaled to increase resolution. The y-axis represents the Gaussian kernel density estimate of the probability density function. Dotted grey lines denote medians of IgG level fold change distributions. Sample sizes are indicated alongside the respective distribution. *** p < 0.001 (Wilcoxon signed-rank test).

