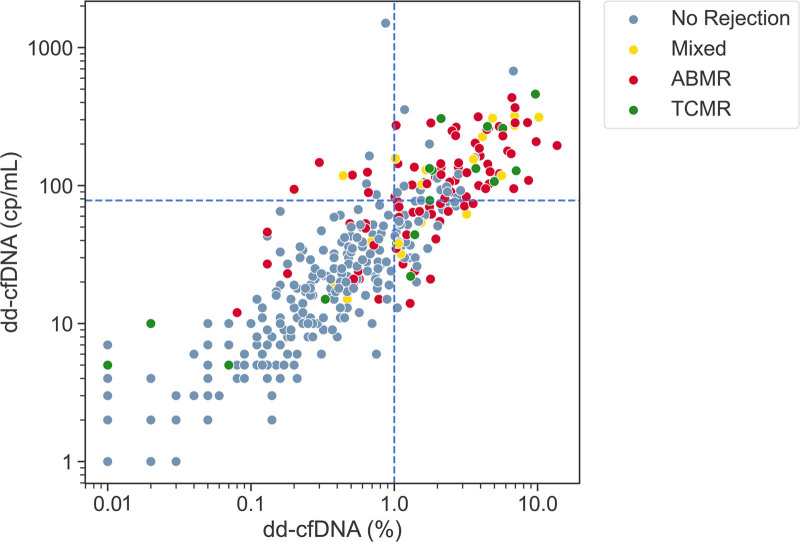
FIGURE 3.
Plot of dd-cfDNA fraction (%) and quantity (cp/mL) for the full cohort (n = 367). The blue dashed horizontal and vertical lines indicate the dd-cfDNA quantity (78 cp/mL) and fraction (1%) thresholds, respectively. Patients with biopsy-proven rejection: AMR, TCMR, and Mixed, as adjudicated by MMDx, are depicted as red, green and yellow dots, respectively. Patients with biopsies that show nonrejection are represented by gray dots. The two-threshold algorithm considers samples in the lower-left quadrant as low risk for rejection, and samples in the remaining 3 quadrants, those with either dd-cfDNA quantity or fraction above the relevant thresholds, as high risk for rejection. AMR, antibody-mediated rejection; dd-cfDNA, donor-derived cell-free DNA; MMDx, molecular microscope diagnostic system; TCMR, T-cell-mediated rejection.

