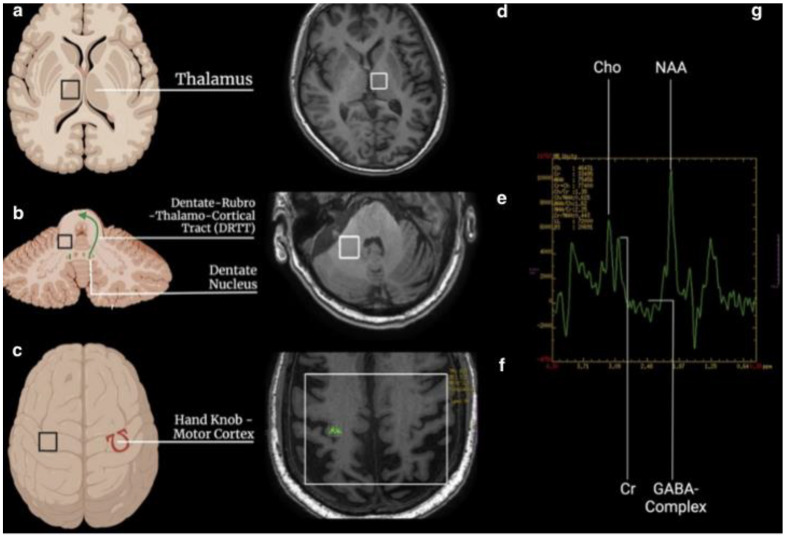
Figure 1.
Schematic representation of ROI placement for MRS acquisition. (a–c): localization of the regions of interest (black square) in the thalamus, dentate nucleus, and hand knob, respectively. The green arrow represents the DRTT, while the omega sign Ω in red is the hand knob. (d–f): the same localization of the region of interest (white square) on MRI brain images. (g): spectroscopy curve with the peak of choline (Cho), creatine (Cr), N-acetyl-aspartate (NAA), and GABA-complex.

