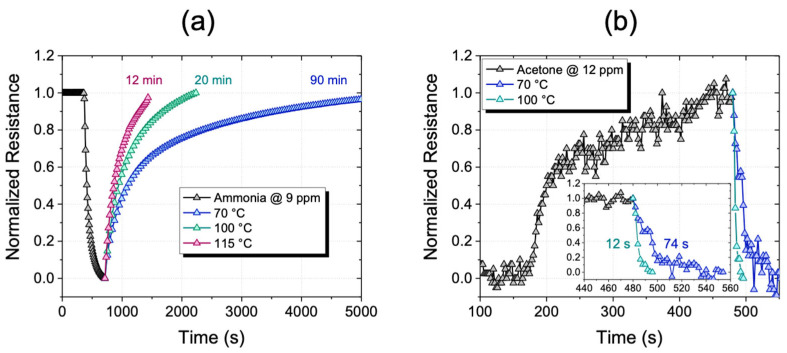
Figure 6.
(a) Sensor electrical profile with 9 ppm of NH3 for 5 min. Recovery times at 70 °C, 100 °C, and 115 °C are shown with blue, green and red lines respectively. (b) Sensor electrical profile with 12 ppm of acetone for 5 min in the inset, an enlargement of the time scale on the sensor recovery time at temperatures of 70 °C (blue line) and 100 °C (green line).

