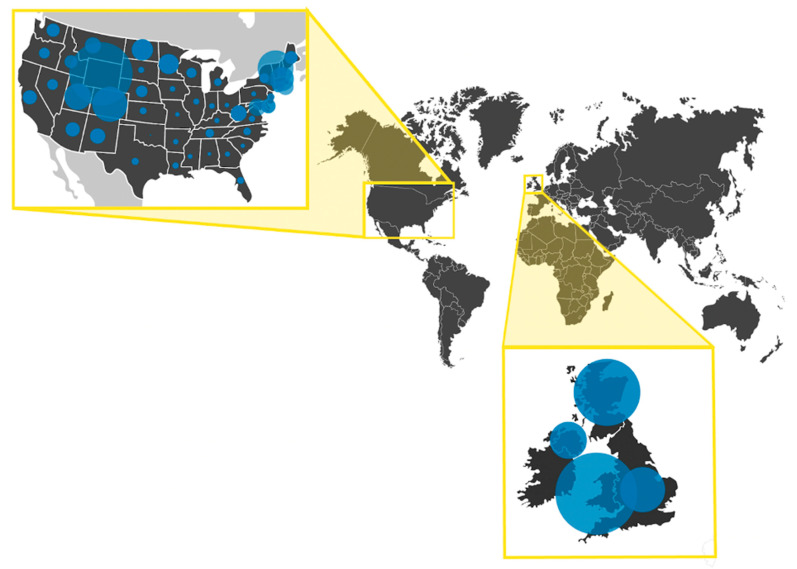
Figure 5.
Relative sequence availability in the US and UK varies by region. The proportion of sequences from each state (USA) or region (UK) was calculated by dividing the sequence count from each region by the number of total sequences in the country (from GISAID as of 5 September 2022). Similar calculations were used to calculate the proportion of the population. The ratio of these two metrics is represented by the blue circles on the map.

