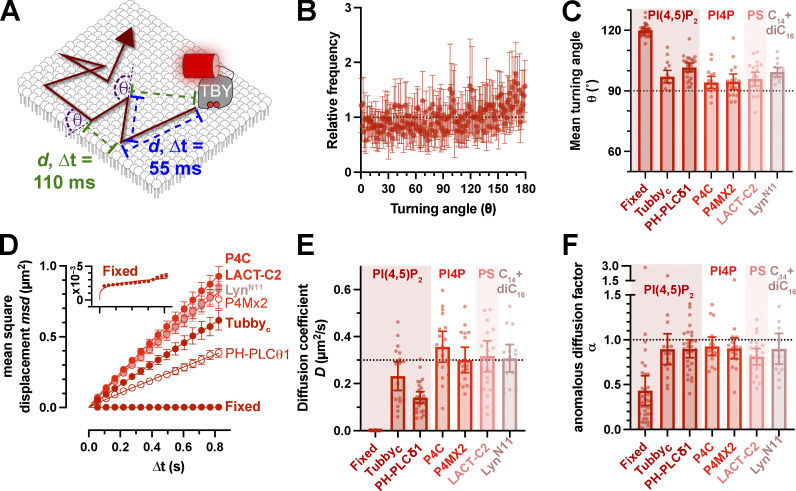
Figure 3.
Rapid Brownian diffusion of lipid biosensors in the PM. (A) Single particle tracking PALM using PAmCherry-tagged lipid biosensors produces trajectories with measured displacements d between localizations separated by various camera exposure-derived time lags, ∆t. The turning angle θ between successive displacements can also be measured. (B and C) The distribution of turning angles measured from 18 cells expressing Tubbyc-PAmCherry (means ± 95% C.I.), which is more conveniently represented in C as the mean turning angle, is close to 90° (no bias in turning angle) for a variety of lipid biosensors. (D) These lipid biosensors display a linear increase in mean square displacement over time, indicating Brownian motion. Fit is to msd = 4D∆tα. (E and F) Mean diffusion coefficients (E) and anomalous diffusion factor, α (F), from individual HeLa cells for the indicated lipid biosensors are shown. The inset for D shows a zoomed axis for the fixed cell data. Data in C–F are grand means ± 95% C.I. of trajectories from 18 (Tubbyc, P4C, and P4Mx2), 27 (PH-PLCδ1), 22 (Lact-C2), 16 (LynN11), or 35 (Tubbyc-fixed) cells.

