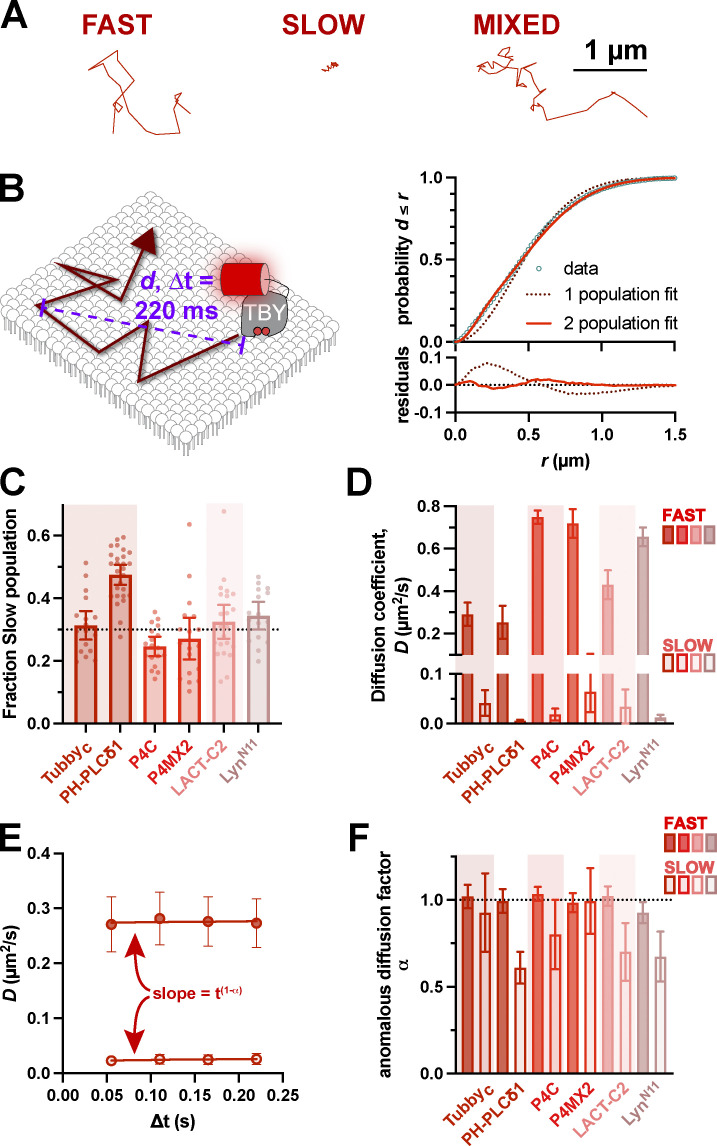
Figure 4.
Existence of both fast and slow diffusing lipid molecules in the PM. (A) Examples of representative single-molecule trajectories, showing either fast-moving, slowly moving, or mixed trajectories. (B) Separating trajectories from all molecules into distinct radial displacements (d) at defined ∆t (e.g., 220 ms) allows D to be estimated from the distribution of d values independently of individual (often mixed) trajectories. This distribution is much more tightly estimated by assuming two populations, one fast and one slow. (C) Fraction of radial displacements assigned to the slowly diffusing population. (D) Mean diffusion coefficients for both fast and slow populations of each lipid biosensor. (E) By comparing D values from the distribution of radial displacements at different ∆t values (i.e., 55, 110, 165, and 220 ms), the dependence of D on time interval can be estimated as the slope t1−α, where α = 1 reveals no change and α < 1 indicates decreasing apparent D with time. Data are from the Tubbyc biosensor and are grand means ± 95% C.I. (18 cells). (F) Anomalous diffusion factor α for both fast (closed) and slow (open symbols) for each biosensor. Only slowly diffusing molecules show evidence of anomalous diffusion. For (B, C, and E), data are grand means ± 95% C.I. of measurements from the same 18 (Tubbyc, P4C, and P4Mx2), 27 (PH-PLCδ1), 22 (Lact-C2), or 16 (LynN11) cells as shown in Fig. 2.

