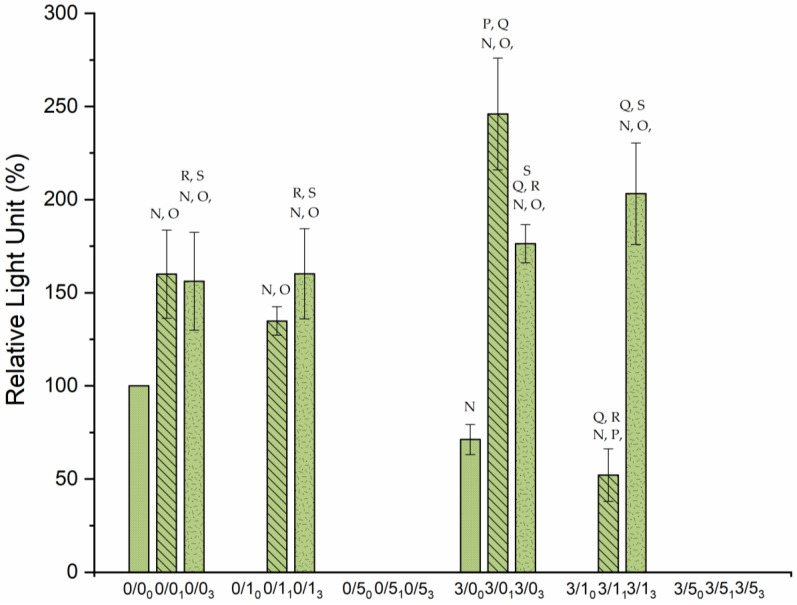
Figure 7.
Biofilm viability results created on PLA film in percentage of relative light units. The smooth bars are for non-degraded samples, the diagonally hatched bars are for the samples degraded for one month, and the notched bars are for the samples degraded for 3 months. Statistical difference (p < 0.05) is marked with the different letters depending on which sample it is compared with. The letters N is used to 0/00; O is used to 3/00; P is used to 0/01; Q is used to 0/11; R is used to 3/01; S is used to 3/11.

