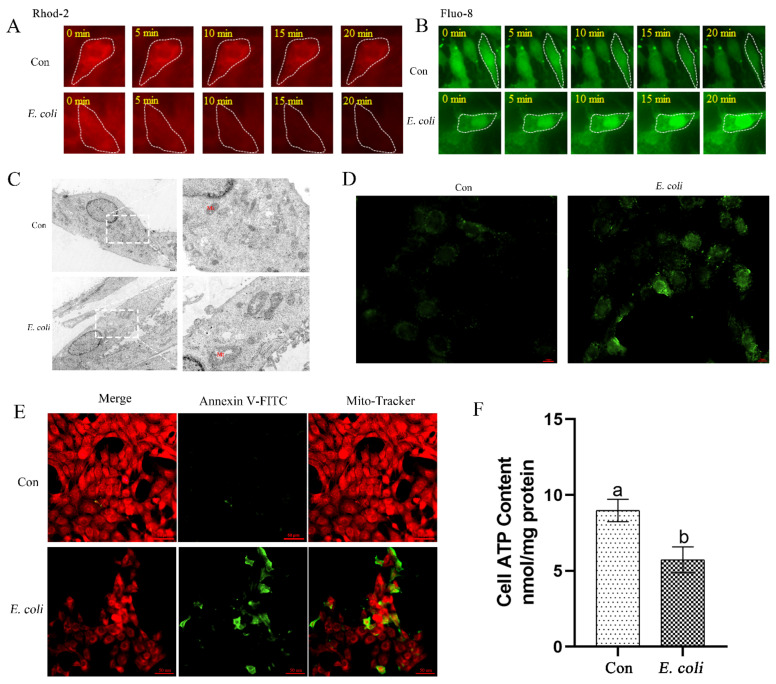
Figure 2.
Effects of E. coli on calcium mobilization and mitochondrial function in bEECs. Primary bEECs were either uninfected or infected with E. coli and cytoplasmic Ca2+ levels and cellular mitochondria function was measured. (A) Mitochondrial Ca2+ reporter Rhod-2 was used for real-time cellular imaging to measure mitochondrial Ca2+ levels. The cells were infected with or without E. coli for up to 20 min. (B) Fluo-8 AM was used to monitor cytosolic Ca2+ levels in real time. Cells were exposed or not exposed to E. coli for up to 20 min. (C) The mitochondria in bEECs were analyzed by transmission electron microscopy after infection with E. coli for 6 h. (D) ROS was measured after infection with E. coli for 6 h. Scale bars = 10 μm. (E) Cells were infected with E. coli for 6 h, and membrane potential was detected by Mito-Tracker Red CMXRos. Scale bars = 50 μm. (F) The ATP concentration was detected using an ATP assay kit after infection for 6 h. Con, no infection control; Mt, mitochondria. The data are means ± SEM of three independent experiments. Bars with different letters indicate significant differences (p < 0.05).

