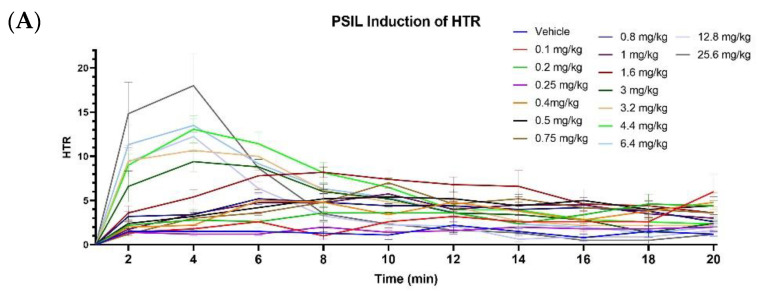
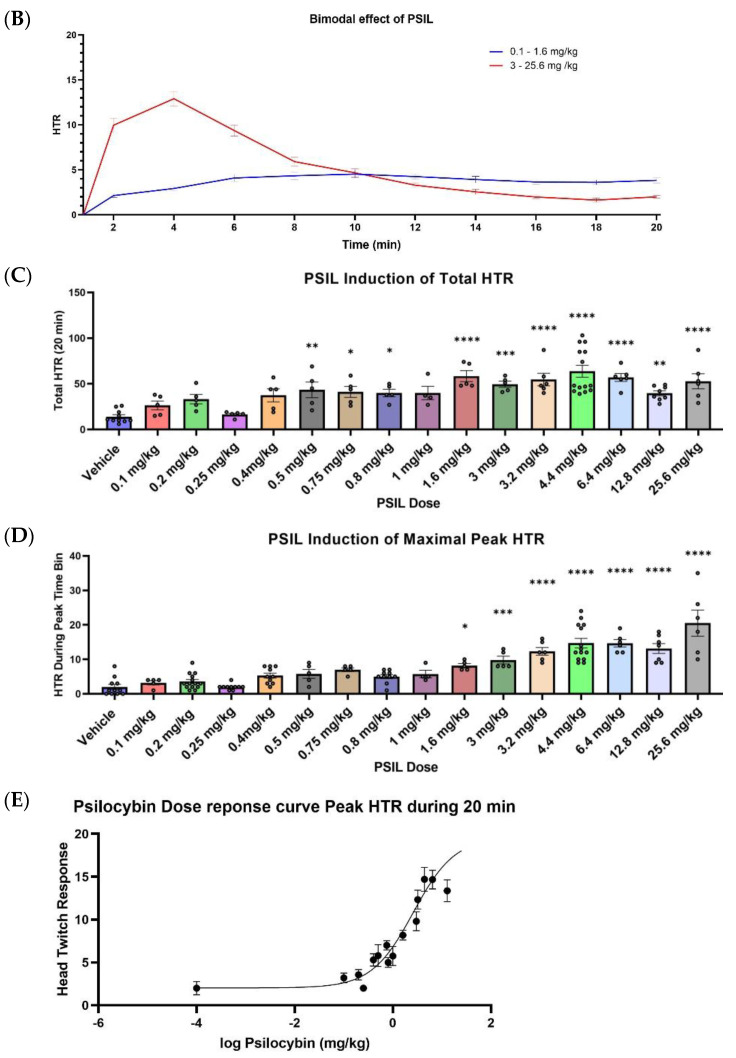
Figure 3.
PSIL induced HTR, over time (A), bimodal effect (B), total HTR during 20 min (C) and maximal peak HTR in a 2 min bin over 20 min (D) (n = 5–14). (A) Effect of different PSIL concentrations during HTR over the time course of 20 min post-injection. (B) Bimodal HTR effect of high and low doses over the time course of 20 min post-injection. (C) Total HTR during the 20 min post injection. (D) Maximal peak HTR that was produced in a 2 min time bin over the course of 20 min (E) Logarithmic dose-response curve compiled from peak HTR (D). Compared to vehicle, * p < 0.05, ** p < 0.01, *** p < 0.001, **** p < 0.0001. Error bars represent SEM.


