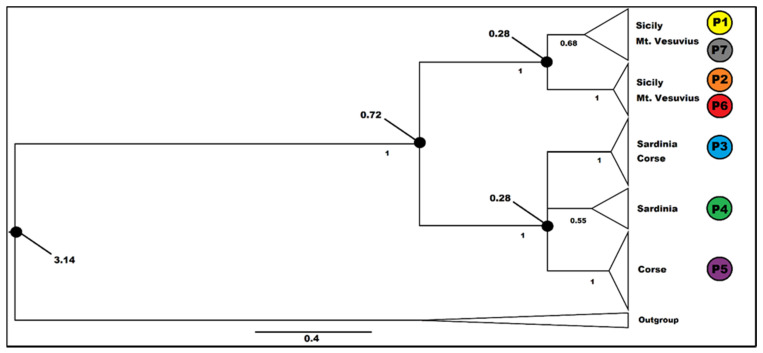
Figure 3.
Calibrated Bayesian analysis on the plastid sequences of the inclusive group in the study of Genista etnensis populations (outgroup = G. fasselata). Posterior probabilities are indicated below the branches (PP > 0.5 are shown); relevant dates (Ma) on the nodes (black circle). Triangles are proportional to the number of individuals. For haplotype distribution and information, see Figure 1.

