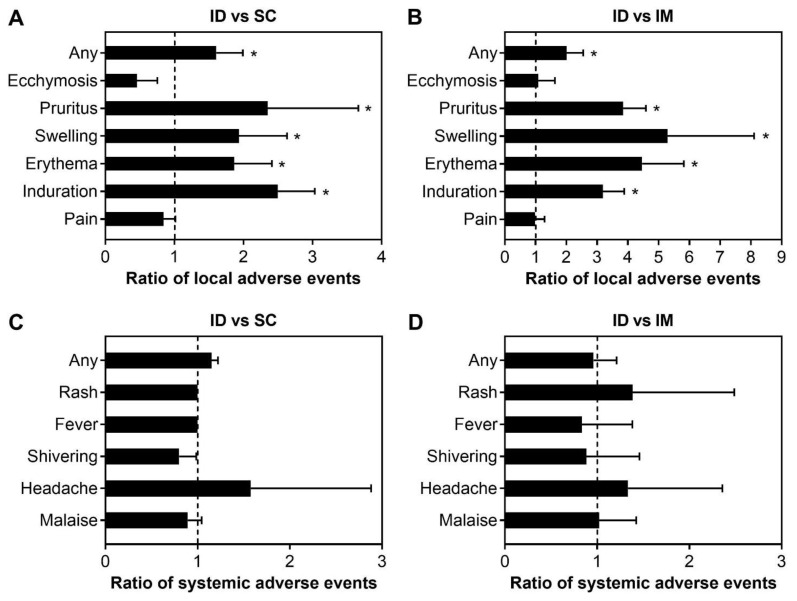
Figure 5.
Comparison of the frequency of local and systemic adverse events elicited by ID versus SC vaccinations (A,C) and ID versus IM vaccinations (B,D) in the elderly. The ratios of the adverse events were calculated by dividing the frequency of these events elicited by ID route over SC or IM routes. A ratio of >1 (dash line) implies higher frequencies of local adverse events elicited by ID route. One sample t-test was used to examine the significant difference in the immunogenicity ratios against hypothesized ratio of 1 with “*” = p < 0.05. If not indicated, the difference in the ratio of adverse events was not statistically significant.

