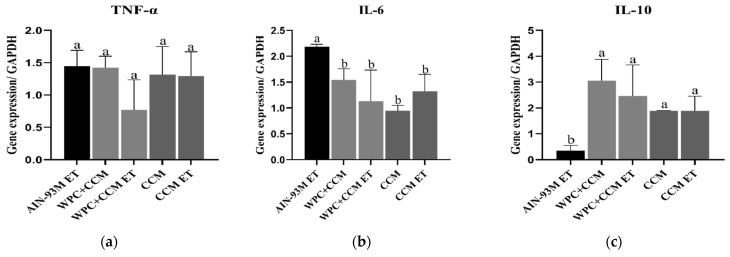
Figure 3.
Gene expression of TNF-α, IL-6, and IL-10 in muscle. AIN-93M: group not submitted to ET that received a standard diet was used as the reference group, and the results expressed concerning it; AIN-93M ET: group submitted to the exhaustion test that received a standard diet; WPC + CCM: group not submitted to ET that received curcumin-added whey protein concentrate; WPC + CCM ET: group submitted to the exhaustion test that received curcumin-added whey protein concentrate; CCM: group not submitted to ET that received curcumin; CCM ET: group submitted to the exhaustion test that received curcumin; ET: exhaustion test. The graphs show (a) TNF-α, (b) IL-6, (c) IL-10. According to ANOVA, different lowercase letters (a,b) indicate significant mean differences among the groups, followed by the Newman–Keuls test, at 5% probability. Same lowercase letters indicate that there was no significant mean difference among the groups. Data expressed as mean ± standard deviation.

