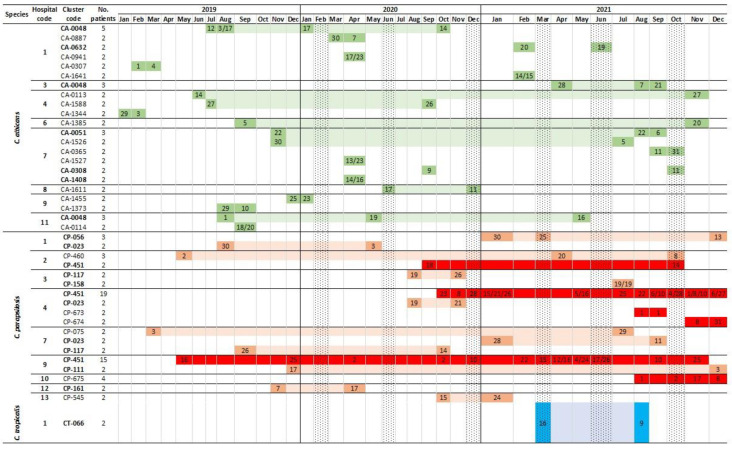
Figure 1.
Timeline of C. albicans (green shades), C. parapsilosis (red shades), and C. tropicalis (blue shades) intra-hospital clusters found in blood cultures during the study period (2019–2021). Genotype codes in bold indicate those that were also widespread clusters. Cells in dark colours with numbers indicate the date the genotype was detected in a given patient within each cluster; cells in light shades indicate the latency period (time period spanning two time points in which isolates in a cluster were detected) of the cluster in the hospital. Cells in dark red indicate fluconazole-resistant C. parapsilosis genotypes. Dotted cell columns represent the onset of each COVID-19 wave.

