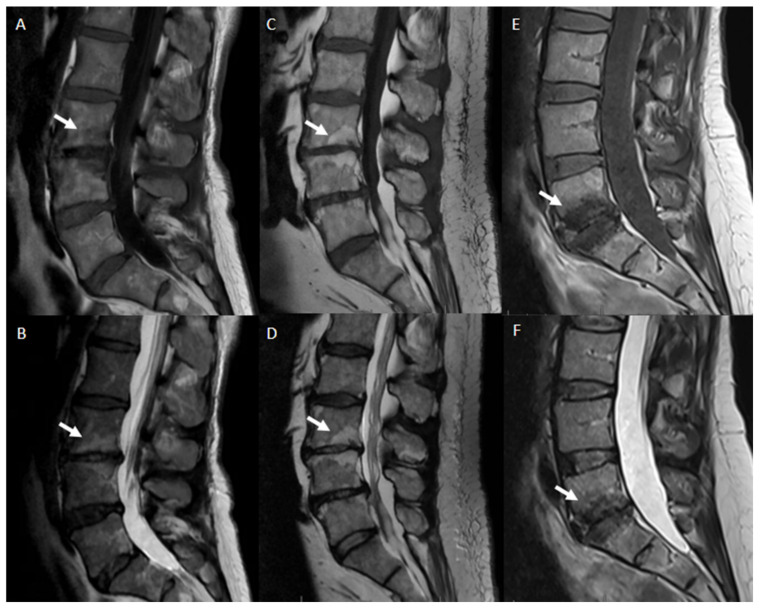
Figure 4.
Modic alterations, sagittal T1-weighted and T2-weighted MR images. Modic 1 (A,B): T1-hypointensity and T2-hyperintensity at L3–L4 representing bone edema (white arrows). Modic 2 (C,D): T1-hyperintensity and T2-hyperintensity at L3–L4 representing fat degeneration and red (haemopoietic) bone marrow conversion to yellow (fatty) bone marrow(white arrows). Modic 3 (E,F): T1-hypointensity and T2-hypointensity at L5–S1 representing subchondral bone sclerosis (white arrows).

