Figure 2.
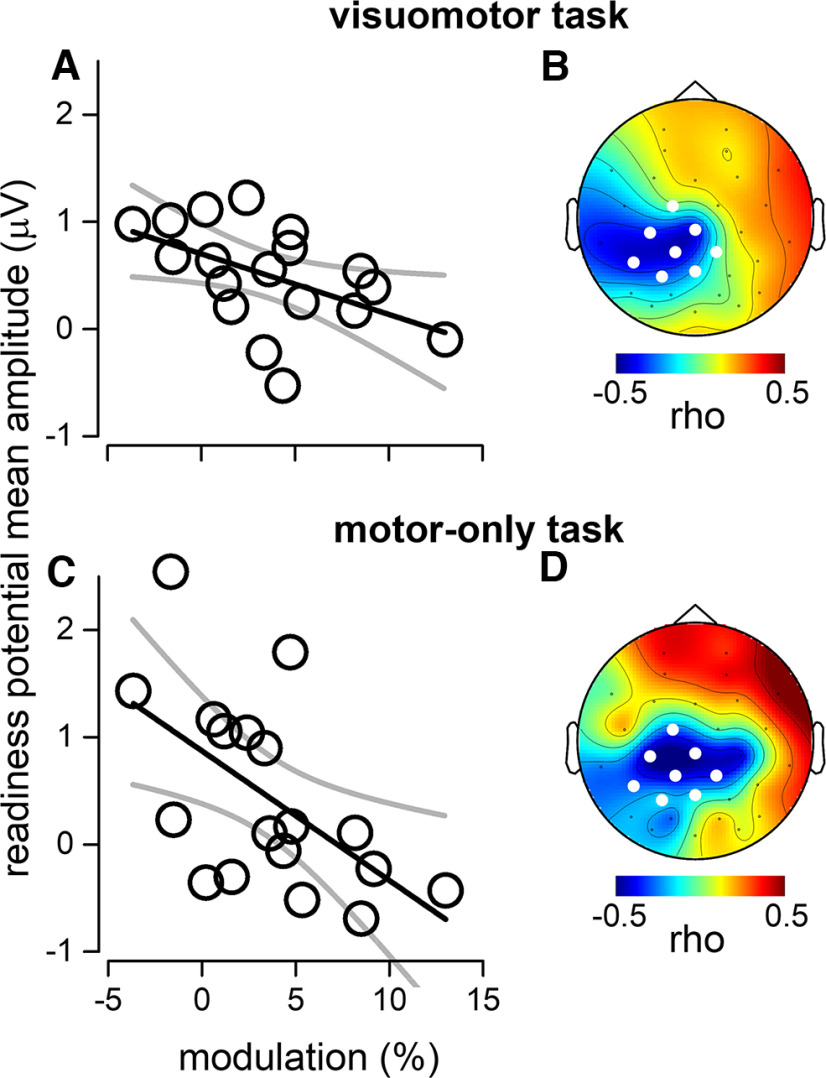
Results of correlational analyses. A, Correlation between readiness potential and motor-induced modulation of visual perception across subjects in the visuomotor task (i.e., with visual stimulus). The magnitude of the perceptual modulation is plotted along the x-axis, and amplitude of the readiness potential averaged across the electrodes of interest (computed within the time interval from −500 to −100 ms relative to motor action) along the y-axis. The black solid line represents the best fit of the linear regression analysis and its 95% confidence bands. B, The topographic map of the Pearson’s correlation coefficient calculated for each electrode; the electrodes of interest are highlighted in white: FC1, C3, CZ, CP5, CP1, CP2, P3, and PZ. See Extended Data Figure 2-1 for single channel correlation results. C, Same as in A, but the amplitude of the readiness potential was estimated during the motor-only task (i.e., without visual stimulus). The correlation between this response and the magnitude of the modulation in visual accuracy around the time of action execution (from the visuomotor task) was also significant (p < 0.05). D, Same as in B during the motor-only task. In addition, analyses on the visual-evoked responses are reported in Extended Data Figure 2-2.

