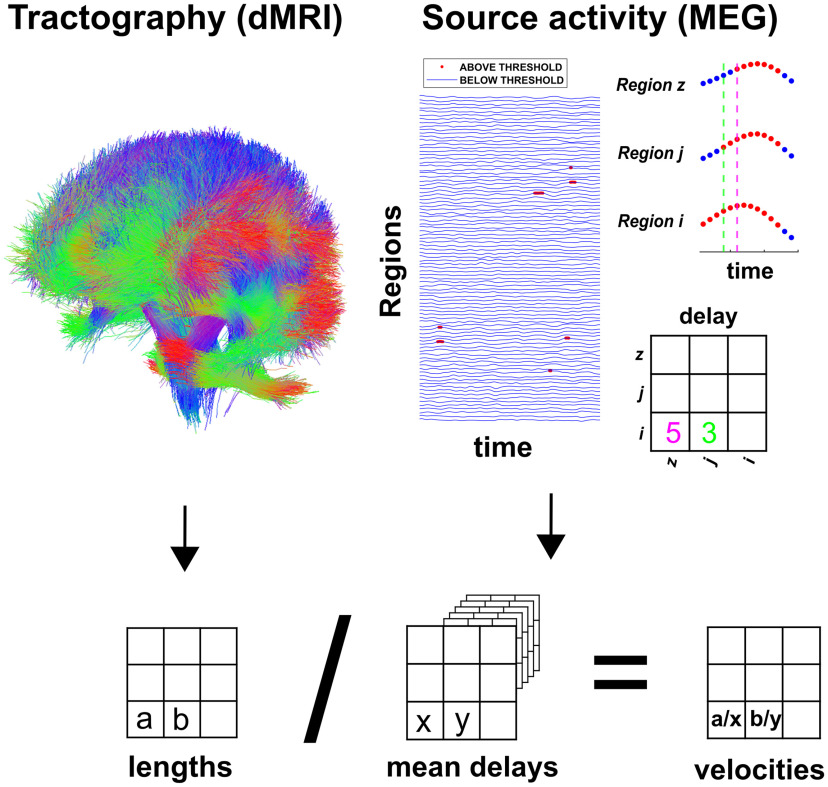
Figure 1.
Top left, The structural connectome. From the tractography, we obtained an estimate of each tract length. Averaging across subjects provided a group-level estimate. Top right, Source-reconstructed MEG time-series. The time points that are below a threshold are represented in blue, while the timepoints above the threshold are in red (the red dots have been magnified). In the example, after region i rose above the threshold (and, hence, the neuronal avalanche had started), it took region j three timesteps to be recruited and five timesteps for region z. The entries of the matrix are expressed in samples. Delays in the manuscript are expressed in seconds. Bottom, Each subject-specific length matrix was divided element-wise by the corresponding estimated delay to obtain a subject-specific velocity matrix.

