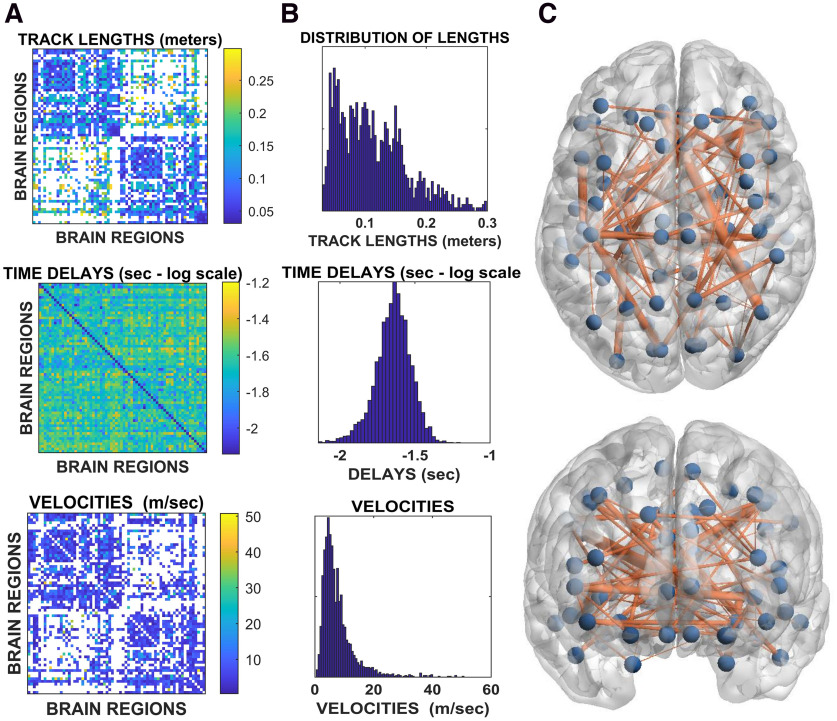
Figure 2.
A, Top, Tract lengths. Rows and columns represent brain regions, and the color code conveys the corresponding length of the tract linking any two regions. Middle, Group average of the delays. Rows and columns represent brain regions, while the color code represents the average time it took region j to become active provided region i had been active earlier. Values are in seconds and reported on a log-scale to highlight the texture of the delay matrix, which appears to be strongly correlated to the length matrix. Bottom, As before, brain regions are represented as rows and columns, while the matrix entries represent the velocities, expressed in meters/s. B, Top, middle, and bottom, Histograms corresponding to the matrices for the lengths, delays, and velocities, respectively. C, The glass-brain provides an overview on the topography of the functional edges with fast functional velocities. In particular, the blue dots represent brain regions, and the edges signify the velocities. Only structural connections with transmission speed higher than 15 m/s are shown. The width of the edge is proportional to its velocity.

