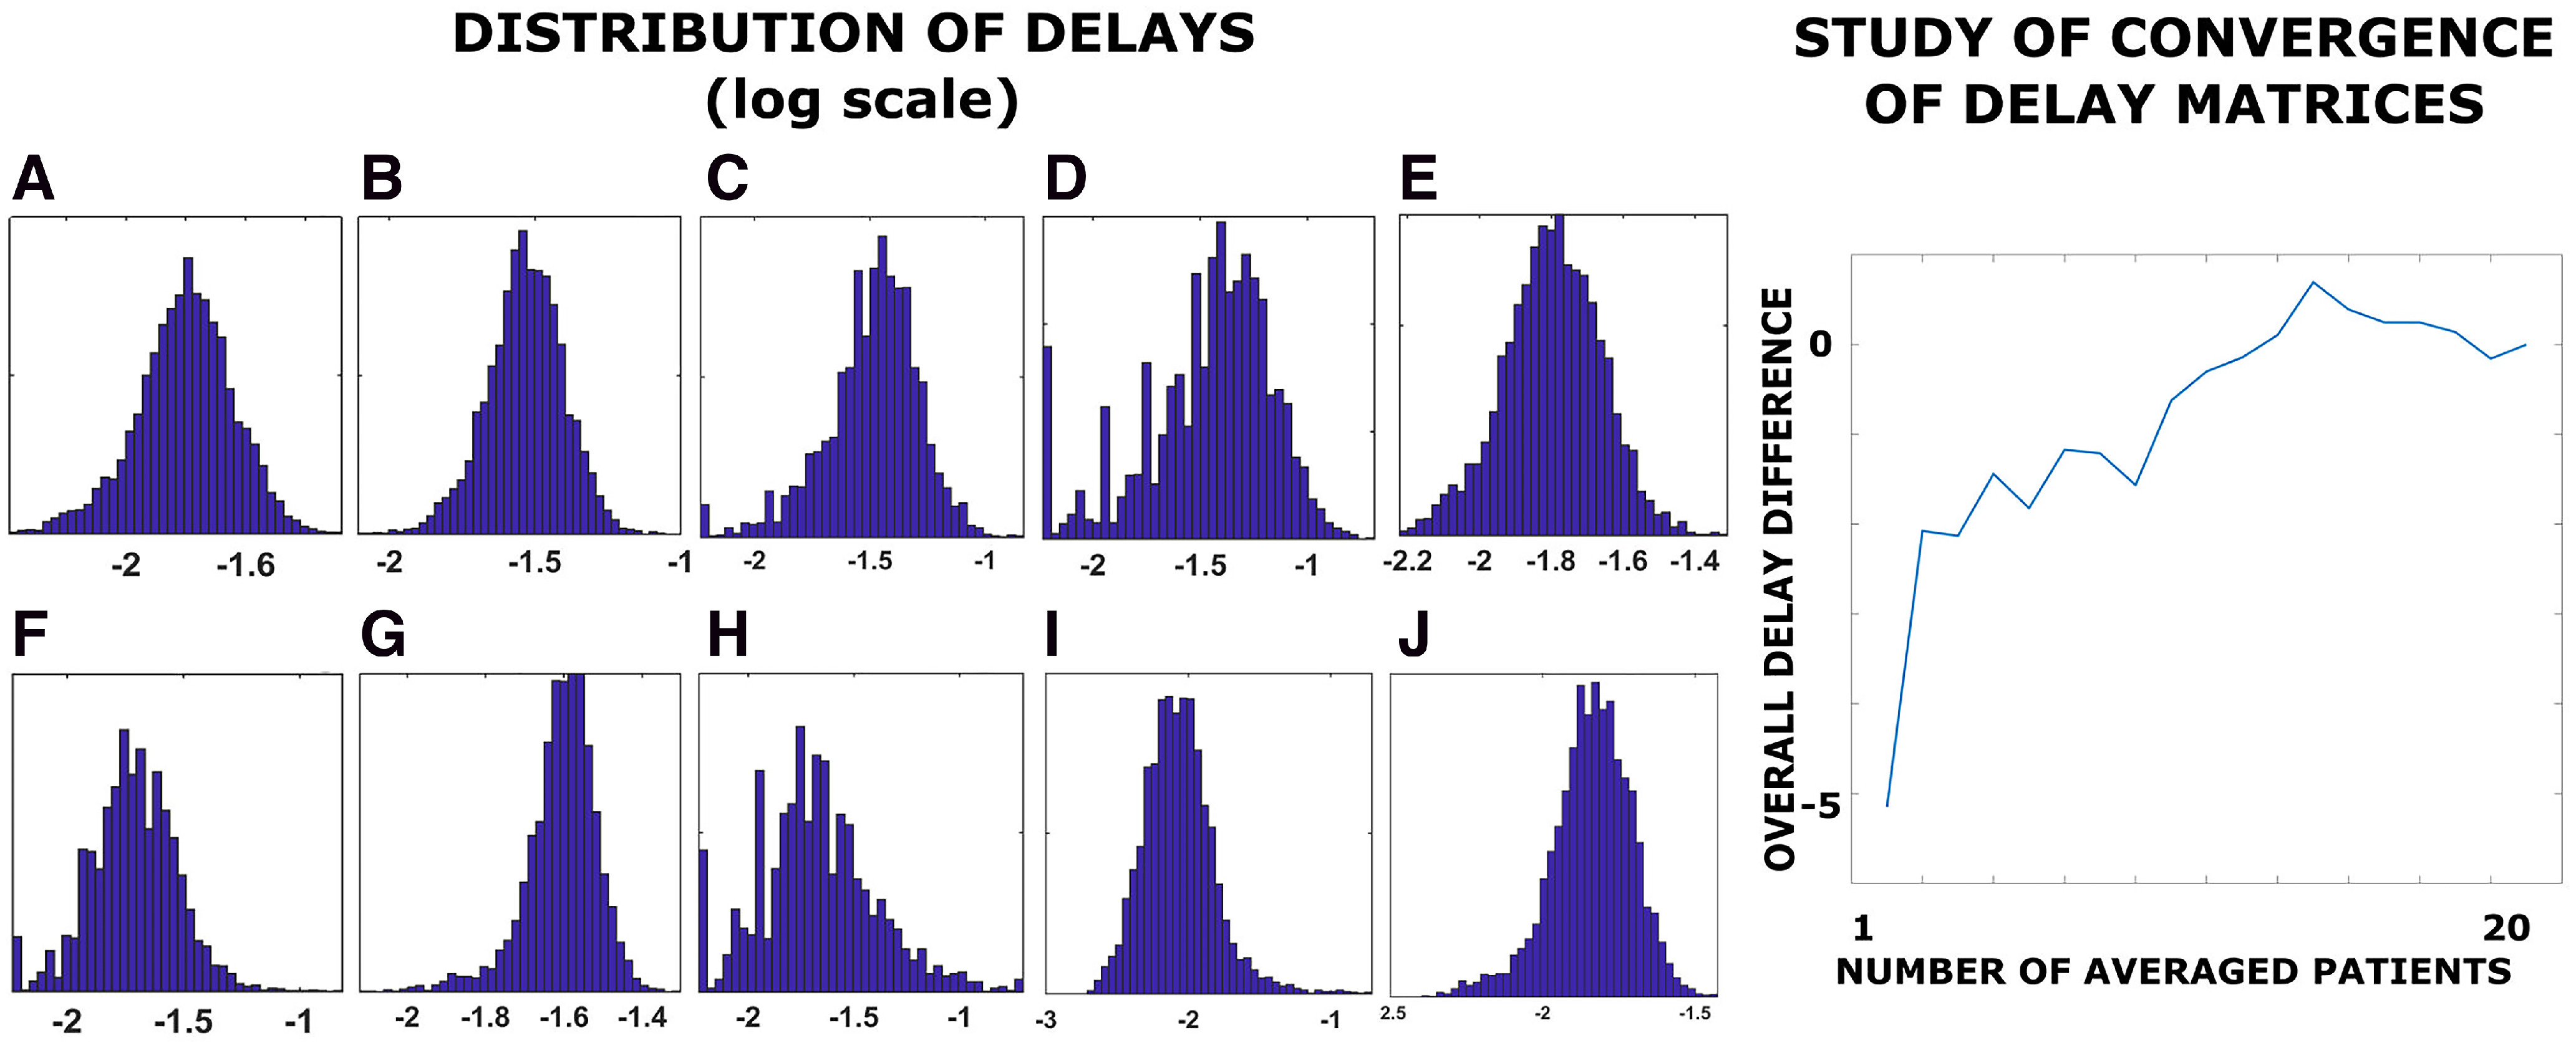
Figure 5.

Left, Distribution of delays (log-scale). A, Delays estimation with binning = 2. B, Delays estimation with binning = 4. C, Delays estimation using avalanches with size >10. D, Delays estimation using avalanches with size >15 bins. E, Delays estimation using all available avalanches. F, Replication of the delays estimation based on an independent cohort, based on source-reconstructed EEG and tractography. G, Delays estimation with a z score >±|2.5|. H, Replication of the delays estimation with a z score >±|3.5|. I, Delays estimation using the “residual variance” as a source-reconstruction algorithm. J, Delays estimation based on an independent cohort of 47 young healthy subjects, based on source-reconstructed MEG and tractography (parcellation according to the AAL atlas is shown). Right, Analysis of convergence. On the x-axis, the image shows the number of patients over which the delays have been averaged. The y-axis shows the mean difference between the average delays (i.e., across all edges) estimated in x subjects and the average delays estimated in x–1 subjects. The differences converge around zero as the delays were averaged across a growing number of participants.
