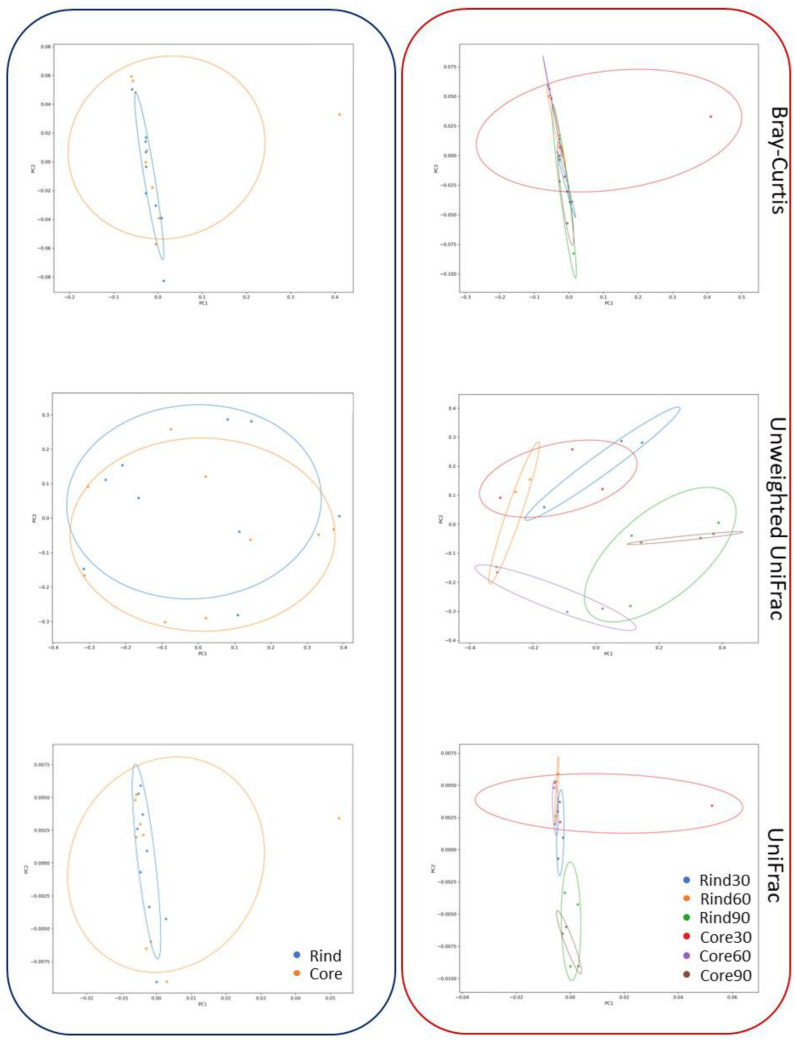
Figure 1.
PCO plots of the 16S rRNA gene-sequencing data. The overall DNA-based dataset is visualized as PCO plots according to Bray–Curtis similarity, unweighted UniFrac, and UniFrac. Blue framed plots depict samples sorted according to the cheese-wheel depth (i.e., rind or core). Red-framed plots depict samples stratified according to both the cheese-wheel depth and ripening timepoint.

