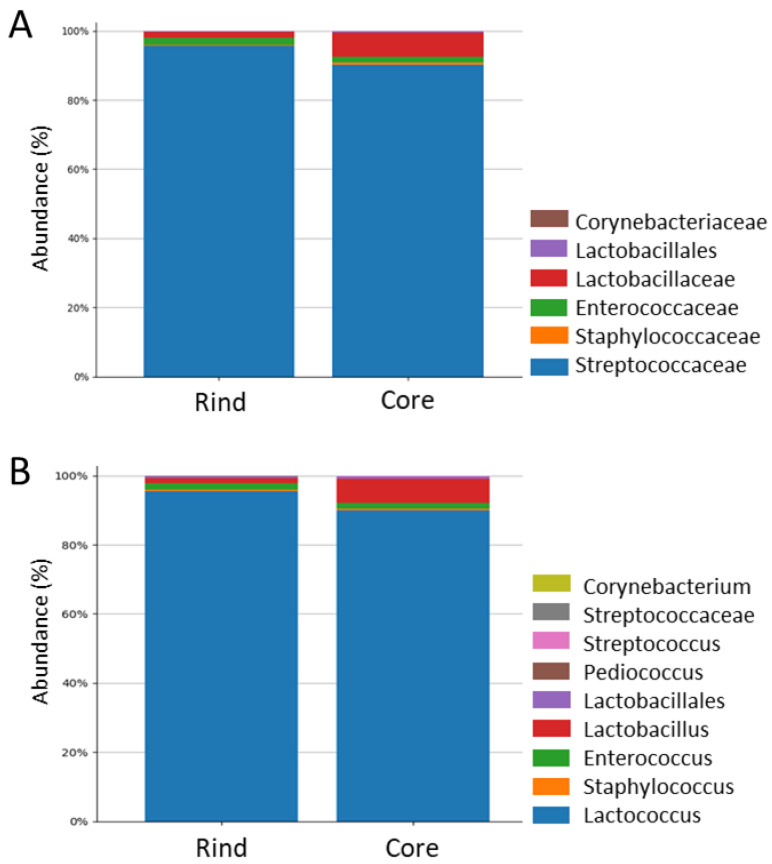
Figure 2.
Microbiota composition assessment by 16S rRNA gene sequencing. The bar charts visualize the composition of the microbial community harbored in the rind and core of the cheese wheel regardless of the ripening timepoint. (A) Microbiota composition at the family taxon level; (B) microbiota composition at the genus level. Higher taxonomic levels are displayed in both (A,B) when it was not possible to attribute a family or genus to the OTU, respectively.

