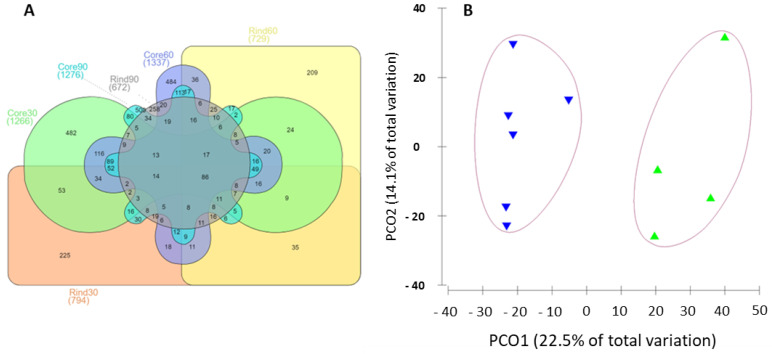
Figure 3.
Metaproteomics dataset. (A) The identified proteins. The Venn diagram displays the number of proteins identified in each of the sample groups taken into consideration in the present study. Specifically, the diagram shows the size of the metaproteome identified in the rind and core samples at the ripening timepoints of 30, 60, and 90 days. (B) The ordination of the dataset in a PCO plot, highlighting the clear separation of the rind and core samples according to their identified protein repertoires.

