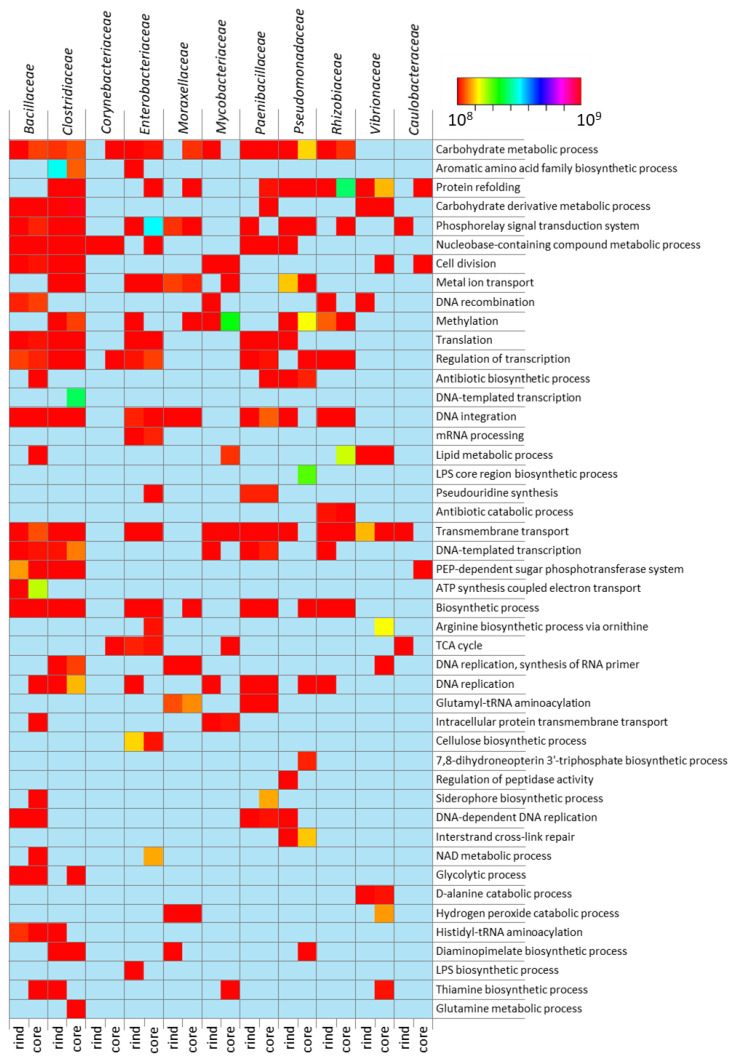
Figure 5.
Functional characterization of the rind and core microbiota. The heatmap displays the biological processes participated in by the microbiota of the core and rind. The figure details the functional concerns of the bacterial families whose cumulative protein abundance was above the pre-fixed threshold of 1% total protein abundance. The color scale is relative to the protein abundance intensity.

