Figure 2.
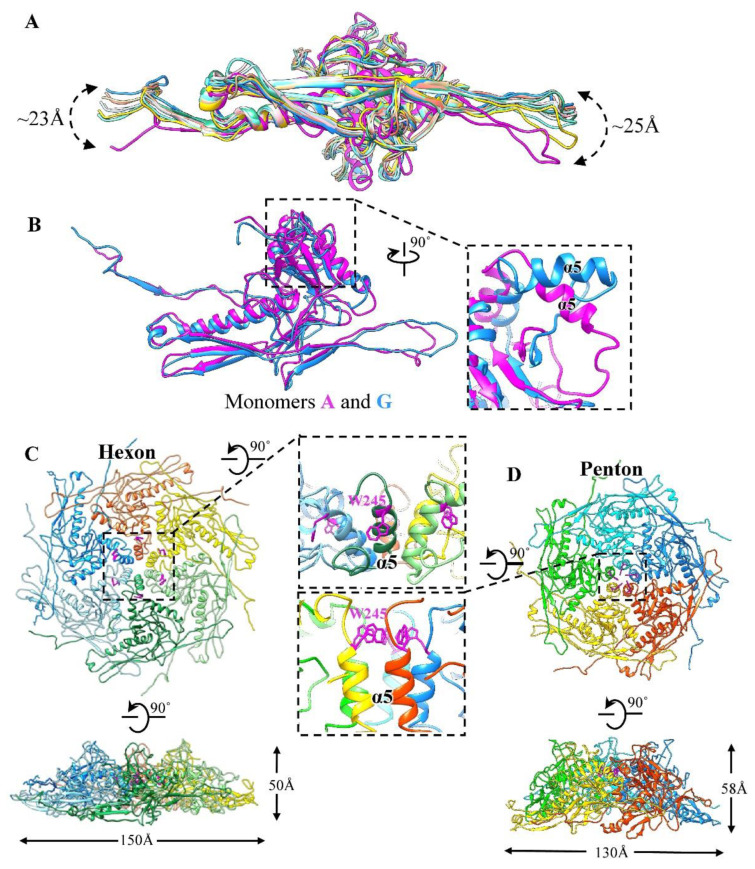
Structure of MCPs. (A) Superimposition of the nine MCPs with different colors showing global conformational changes. (B) Superimposition of monomers A and G with the same color schedule but a different view to (A). The inset is a zoom-in view of the conformational changes of α5 (residues 230–278) in the A-domain. (C,D) The hexon and penton (six and five subunits in different colors) are shown along the top and the side views, respectively. The inset is a zoom-in view of the local region of the hexon/penton A-domains where the side chains of residue W245 (magenta) are shown as stick models.

