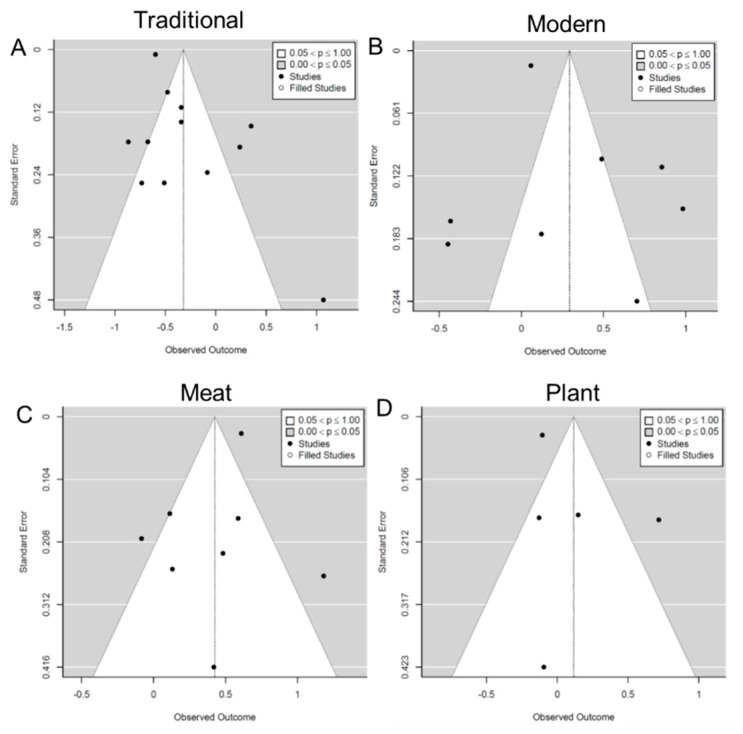
Figure 2.
Funnel plot of pooled odds ratios (ORs) with 95% confidence interval (CI) for the highest versus lowest quantile of the different dietary patterns for overweight/obesity. (A) traditional dietary pattern; (B) modern dietary pattern; (C) meat/animal protein dietary pattern; (D) plant food/vegetarian dietary pattern.

