Figure 5.
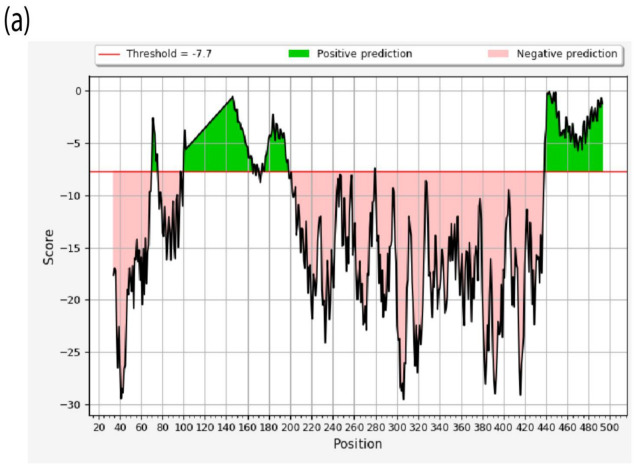
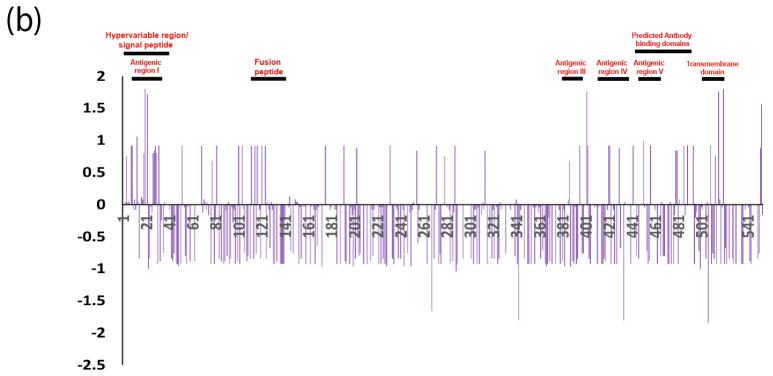
(a) Structure-based Antibody Prediction. X-axis contains the position of residues while the y-axis shows the propensity line indicates the threshold value. Regions above the threshold value, shown in green, are representing the residues under positive prediction. (b) The cumulative dN/dS of the average synonymous and non-synonymous substitutions moving codon by codon across F protein of AOAVv-1 isolates reported in Jordan including the reported isolates in this study with highlighting the most affected domains (high selective pressure) within the F protein.


