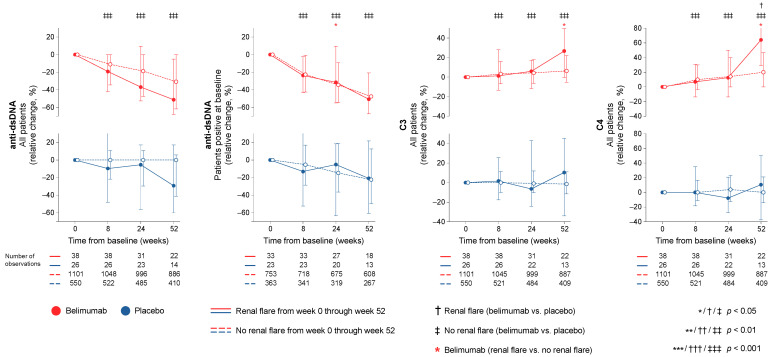
Figure 3.
Changes in serological markers in relation to renal flares. The graphs delineate relative to baseline percentage changes in anti-dsDNA, C3, and C4 levels in patients who developed at least one renal flare during the study period (continuous lines) and patients who did not (dashed lines). Comparisons between patients who flared and patients who did not were conducted using multivariable logistic regression analysis to account for potential confounders and are illustrated for patients who received non-biological standard therapy plus belimumab (red lines) and patients who received non-biological standard therapy alone (blue lines). For anti-dsDNA levels, a separate analysis for patients with positive anti-dsDNA levels (≥30 IU/mL) at baseline is also demonstrated. Comparisons between treatment arms were conducted using non-parametrical Mann–Whitney U tests. Whiskers indicate the interquartile range of distributions. The number of patients with available data at each time point is indicated for each patient subgroup. Anti-dsDNA: anti-double-stranded DNA antibodies; C3: complement component 3; C4: complement component 4.

