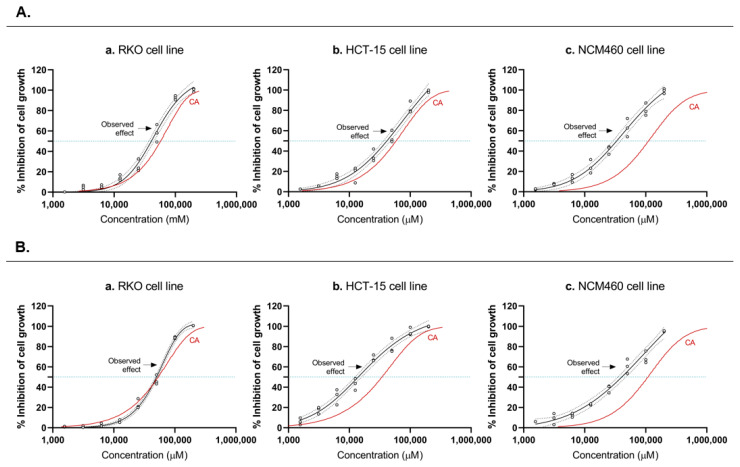
Figure 2.
Predicted and observed effects of the SCFAs mixtures. (I,II) Predicted and observed effects of the SCFAs mixtures I (A) and II (B) of the three tested SCFAs in RKO (Aa,Ba), HCT-15 (Ab,Bb) and NCM460 (Ac,Bc) cells by SRB assay. Individual data points are represented by black circles, and the best-fit regression model is shown by the black line, labeled “observed effect”. Black dashed lines represent the upper and lower 95% CI for the regression fit. The solid red line shows the prediction according to concentration addition (CA). The blue dotted lines show the IC50 for each response curve (for values see Table 2). Experimental data were obtained from a minimum of three independent experiments run in triplicate.

