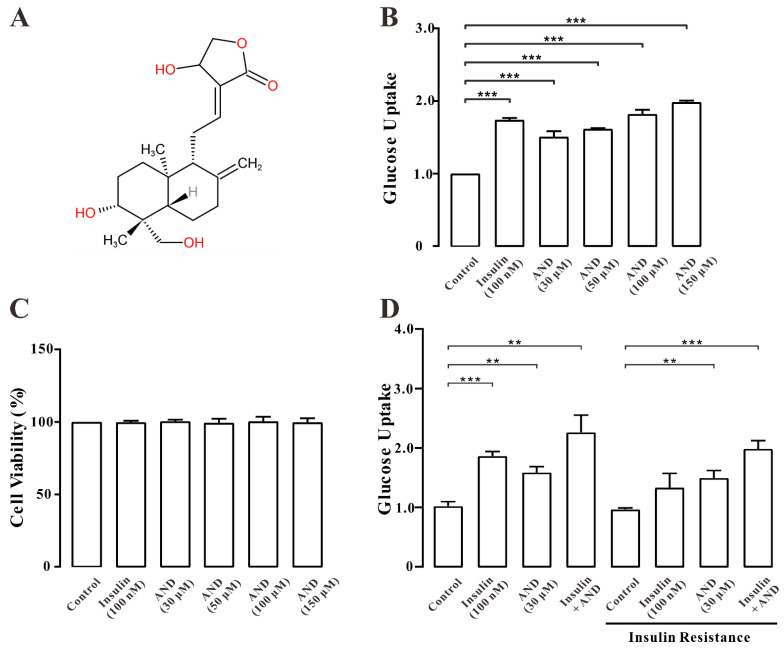
Figure 4.
AND promoted the uptake of glucose in L6 cells. (A) Chemical structure of AND. (B) Values on the Y-axis represent the fold relationship of glucose uptake by L6 cells compared with that in normal conditions. Uptake of glucose in L6 cells under the incubation of AND or insulin, the data represent the mean ± s.e.m. of values from three separate experiments. (C) Toxicity of AND to L6 cells, the data represent the mean ± s.e.m. of values from three separate experiments. (D) Values on the Y-axis represent the fold relationship of glucose uptake by L6 cells compared with that in normal conditions. Uptake of glucose in L6 cells induced by AND in insulin-resistant L6 cells, the data represent the mean ± s.e.m. of values from three separate experiments. **: p < 0.01; ***: p < 0.001.

