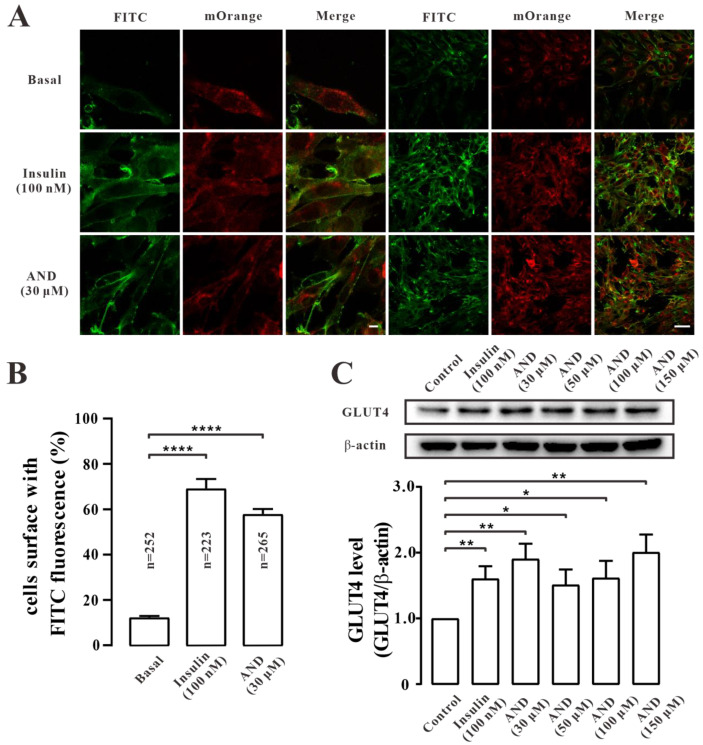
Figure 5.
AND promoted GLUT4 expression and fusion into plasma membrane. (A) FITC fluorescence analysis of L6 cells treated with AND or Insulin. Scale bar: 10 μm for single-cell images and 50 μm for multi-cell images. (B) The number of GLUT4-mOrange-positive cells, the data represent the mean ± s.e.m. of values from three separate experiments with between 200 and 300 cells examined in each experiment. (C) The expression level of GLUT4 after treatment with 100 nM insulin or different concentrations of AND for 30 min in L6 cells. The control group was considered as 1 for data analysis. The data represent the mean ± s.e.m. of values from three separate experiments. *: p < 0.05; **: p < 0.01; ****: p < 0.0001.

