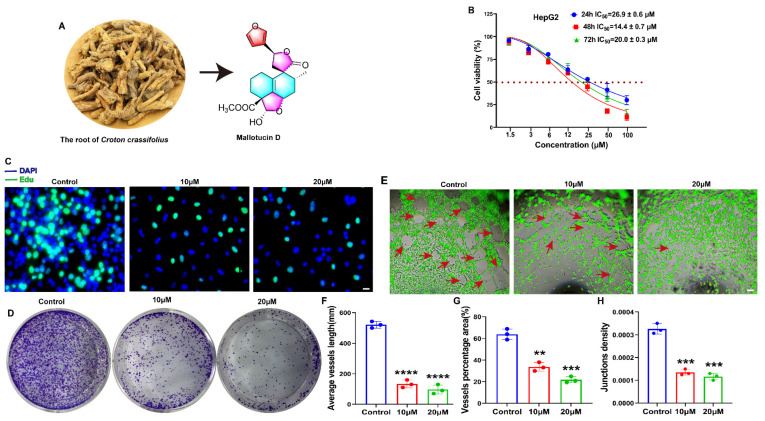
Figure 1.
MLD suppressed the proliferation of HepG2 cells and angiogenesis of HUVECs. (A) Structure of MLD. (B) Cell viability of HepG2 cells after MLD treatment for 24 h, 48 h, and 72 h as determined by MTT assay. (C) The inhibitory effect on DNA synthesis in HepG2 cells was detected by Edu staining after treatment with MLD for 24 h. Scale bar: 100 μm. (D) The inhibitory effect of MLD on HepG2 cell colony formation. (E) The ability of HUVEC angiogenesis was inhibited in MLD-treated cells. Scale bar: 150 μm. Arrow: the angiogenesis-like structure. The statistics of tube-like structure length (F), vessel area (G), and junction density (H). The results are representative of three independent experiments and are expressed as the mean ± SD. ** p < 0.01, *** p < 0.001, and **** p < 0.0001 compared with the control group.

